

Development of Sjogren's syndrome in nonobese diabetic-derived autoimmune-prone C57BL/6.NOD-Aec1Aec2 mice is dependent on complement component-3
- PMID: 17675493
- PMCID: PMC2850056
- DOI: 10.4049/jimmunol.179.4.2318
Development of Sjogren's syndrome in nonobese diabetic-derived autoimmune-prone C57BL/6.NOD-Aec1Aec2 mice is dependent on complement component-3
Abstract
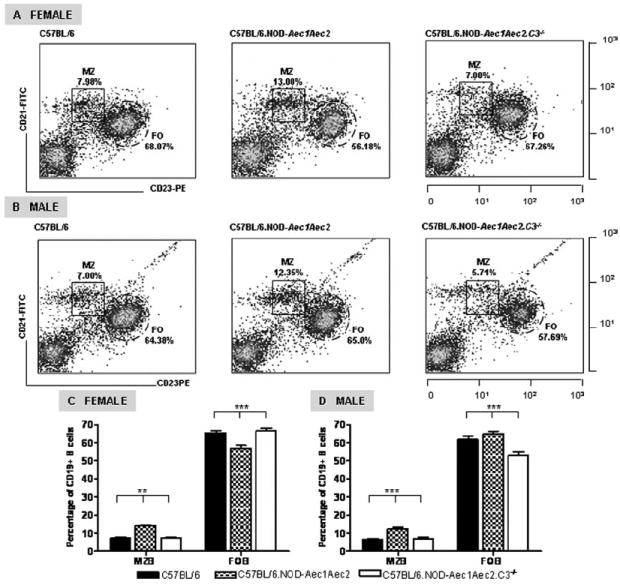
The role of complement in the etiology of Sjögren's syndrome (SjS), a human autoimmune disease manifested primarily by salivary and lacrimal gland dysfunction resulting in dry mouth/dry eye syndrome, remains ill-defined. In the present study, we examined the role of complement component-3 (C3) using a newly constructed C3-gene knockout mouse, C57BL/6.NOD-Aec1Aec2.C3(-/-). Inactivation of C3 in the parental C57BL/6.NOD-Aec1Aec2 strain, a model of primary SjS, resulted in a diminished or total absence of both preclinical and clinical manifestations during development and onset of disease, including reduced acinar cell apoptosis, reduced levels of caspase-3, lack of leukocyte infiltration of submandibular glands, reduced synthesis of disease-associated autoantibodies, maintenance of normal glandular architecture, and retention of normal saliva secretion. In addition, C57BL/6-NOD.Aec1Aec2.C3(-/-) mice did not exhibit increased numbers of marginal zone B cells, a feature of SjS-prone C57BL/6-NOD.Aec1Aec2 mice. Interestingly, C57BL/6-NOD.Aec1Aec2.C3(-/-) mice retained some early pathological manifestations, including activation of serine kinases with proteolytic activity for parotid secretory protein. This improvement in the clinical manifestations of SjS-like disease in C57BL/6.NOD-Aec1Aec2.C3(-/-) mice, apparently a direct consequence of C3 deficiency, supports a much more important role for complement in the adaptive autoimmune response than previously recognized, possibly implicating an essential role for innate immunity.
Conflict of interest statement
Figures


Similar articles
-
Early Covert Appearance of Marginal Zone B Cells in Salivary Glands of Sjögren's Syndrome-Susceptible Mice: Initiators of Subsequent Overt Clinical Disease.Int J Mol Sci. 2021 Feb 15;22(4):1919. doi: 10.3390/ijms22041919. Int J Mol Sci. 2021. PMID: 33671965 Free PMC article.
-
Inflammatory caspases are critical for enhanced cell death in the target tissue of Sjögren's syndrome before disease onset.Immunol Cell Biol. 2009 Jan;87(1):81-90. doi: 10.1038/icb.2008.70. Epub 2008 Oct 21. Immunol Cell Biol. 2009. PMID: 18936772 Free PMC article.
-
IL-4-STAT6 signal transduction-dependent induction of the clinical phase of Sjögren's syndrome-like disease of the nonobese diabetic mouse.J Immunol. 2007 Jul 1;179(1):382-90. doi: 10.4049/jimmunol.179.1.382. J Immunol. 2007. PMID: 17579059 Free PMC article.
-
New concepts for the development of autoimmune exocrinopathy derived from studies with the NOD mouse model.Arch Oral Biol. 1999 May;44 Suppl 1:S21-5. doi: 10.1016/s0003-9969(99)00045-x. Arch Oral Biol. 1999. PMID: 10414851 Review.
-
Sjögren's syndrome: an old tale with a new twist.Arch Immunol Ther Exp (Warsz). 2009 Jan-Feb;57(1):57-66. doi: 10.1007/s00005-009-0002-4. Epub 2009 Feb 14. Arch Immunol Ther Exp (Warsz). 2009. PMID: 19219532 Free PMC article. Review.
Cited by
-
AT-RvD1 combined with DEX is highly effective in treating TNF-α-mediated disruption of the salivary gland epithelium.Physiol Rep. 2016 Oct;4(19):e12990. doi: 10.14814/phy2.12990. Physiol Rep. 2016. PMID: 27694530 Free PMC article.
-
Sjögren's syndrome: studying the disease in mice.Arthritis Res Ther. 2011 Jun 13;13(3):217. doi: 10.1186/ar3313. Arthritis Res Ther. 2011. PMID: 21672284 Free PMC article. Review.
-
Dry eye and designer ophthalmics.Optom Vis Sci. 2008 Aug;85(8):643-52. doi: 10.1097/OPX.0b013e318181ae73. Optom Vis Sci. 2008. PMID: 18677231 Free PMC article.
-
Myeloid Populations in Systemic Autoimmune Diseases.Clin Rev Allergy Immunol. 2017 Oct;53(2):198-218. doi: 10.1007/s12016-017-8606-7. Clin Rev Allergy Immunol. 2017. PMID: 28528521 Review.
-
Age-related Defects in Ocular and Nasal Mucosal Immune System and the Immunopathology of Dry Eye Disease.Ocul Immunol Inflamm. 2016 Jun;24(3):327-47. doi: 10.3109/09273948.2014.986581. Epub 2014 Dec 23. Ocul Immunol Inflamm. 2016. PMID: 25535823 Free PMC article. Review.
References
-
- Fox RI, Kang HI. Pathogenesis of Sjögren’s syndrome. Rheum Dis Clin North Am. 1992;18:517–538. - PubMed
-
- Jonsson R, Haga HJ, Gordon TP. Current concepts on diagnosis, autoantibodies and therapy in Sjögren’s syndrome. Scand J Rheumatol. 2000;29:341–348. - PubMed
-
- Fox RI, Michelson P. Approaches to the treatment of Sjögren’s syndrome. J Rheumatol Suppl. 2000;61:15–21. - PubMed
-
- Vitali C, Bombardieri S, Jonsson R, Moutsopoulos HM, Alexander EL, Carsons SE, Daniels TE, Fox PC, Fox RI, Kassan SS, et al. Classification criteria for Sjögren’s syndrome: a revised version of the European criteria proposed by the American-European Consensus Group. Ann Rheum Dis. 2002;61:554–558. - PMC - PubMed
-
- Fox PC, Speight PM. Current concepts of autoimmune exocrinopathy: immunologic mechanisms in the salivary pathology of Sjögren’s syndrome. Crit Rev Oral Biol Med. 1996;7:144–158. - PubMed
Publication types
MeSH terms
Substances
Grants and funding
LinkOut - more resources
Full Text Sources
Medical
Molecular Biology Databases
Research Materials
Miscellaneous
