. 2007 Oct;145(2):317-29.
doi: 10.1104/pp.107.103465. Epub 2007 Aug 3.

A predicted interactome for Arabidopsis

Affiliations

A predicted interactome for Arabidopsis

Jane Geisler-Lee et al. Plant Physiol. 2007 Oct.

Abstract

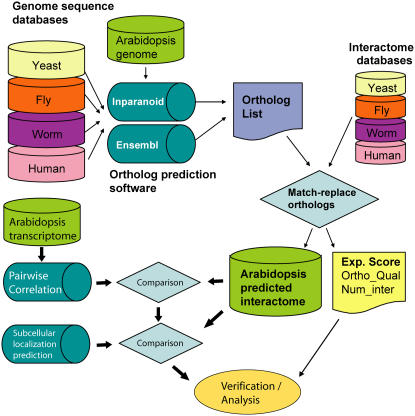
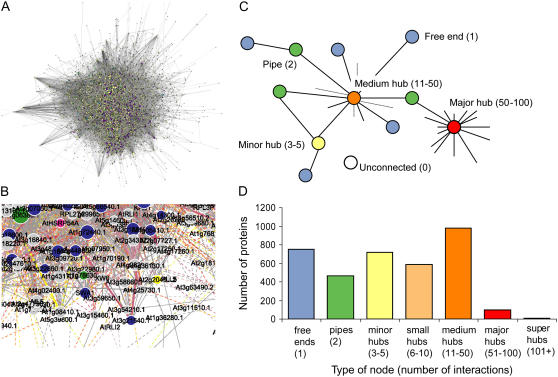
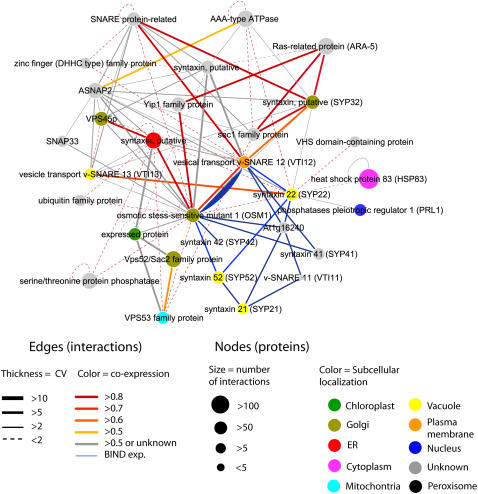
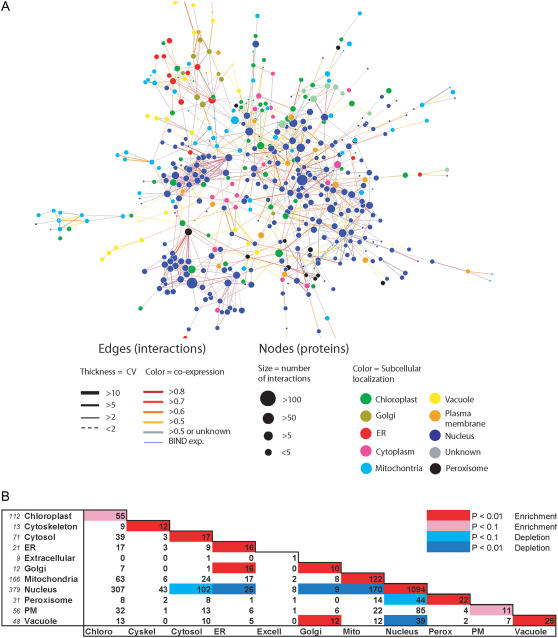
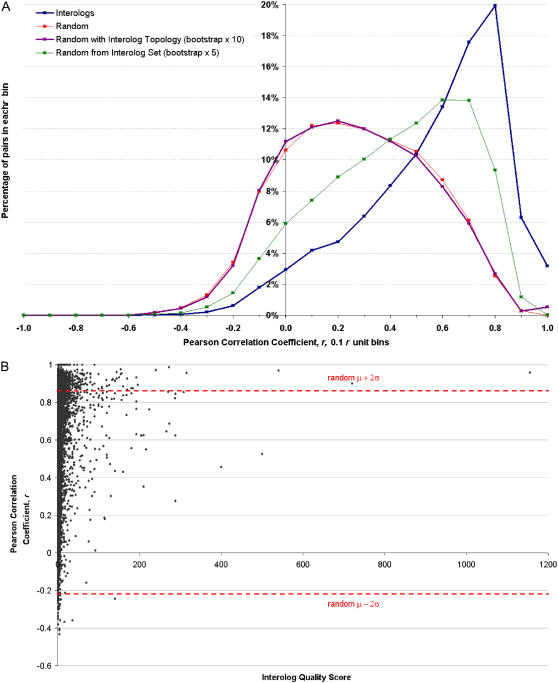
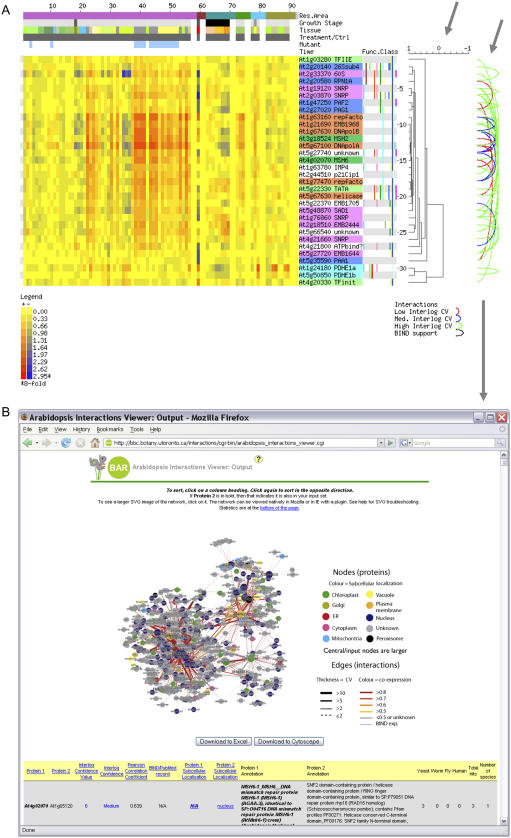
The complex cellular functions of an organism frequently rely on physical interactions between proteins. A map of all protein-protein interactions, an interactome, is thus an invaluable tool. We present an interactome for Arabidopsis (Arabidopsis thaliana) predicted from interacting orthologs in yeast (Saccharomyces cerevisiae), nematode worm (Caenorhabditis elegans), fruitfly (Drosophila melanogaster), and human (Homo sapiens). As an internal quality control, a confidence value was generated based on the amount of supporting evidence for each interaction. A total of 1,159 high confidence, 5,913 medium confidence, and 12,907 low confidence interactions were identified for 3,617 conserved Arabidopsis proteins. There was significant coexpression of genes whose proteins were predicted to interact, even among low confidence interactions. Interacting proteins were also significantly more likely to be found within the same subcellular location, and significantly less likely to be found in conflicting localizations than randomly paired proteins. A notable exception was that proteins located in the Golgi were more likely to interact with Golgi, vacuolar, or endoplasmic reticulum sorted proteins, indicating possible docking or trafficking interactions. These predictions can aid researchers by extending known complexes and pathways with candidate proteins. In addition we have predicted interactions for many previously unknown proteins in known pathways and complexes. We present this interactome, and an online Web interface the Arabidopsis Interactions Viewer, as a first step toward understanding global signaling in Arabidopsis, and to whet the appetite for those who are awaiting results from high-throughput experimental approaches.


Figures

Figure 1.
Figure 1.
Flowchart for the predicted Arabidopsis interactome. A list of Arabidopsis orthologs were identified using INPARANOID and ENSEMBL algorithms (see “Materials and Methods”) from genome databases of yeast, nematode, fruitfly, and human. Where orthologs were found for both partners of a known protein interaction in the reference species, that interaction was mapped to (i.e. replaced with) corresponding Arabidopsis genes. This generated the Arabidopsis predicted interactome and a CV based on the amount of supporting evidence. Subsequent verification and analysis examined each interaction protein pair using Pearson correlation of gene expression profiles in an Arabidopsis transcriptome database (AtGenExpress) and checked for colocalization using SUBA. [See online article for color version of this figure.]
Figure 2.
Figure 2.
Visualizing the Arabidopsis predicted interactome. A, Giant hairy ball of all 19,979 interactions visualized by Cytoscape. B, Enlargement showing example of some detail captured by visualization. C, Different types of protein nodes classified as major hubs when interacting with 50 to 100 other proteins, medium hubs 11 to 50, minor hub three to five, pipes two, free end one, and unconnected zero interacting proteins. D, Frequency distribution of different node classes based on number of interacting partners.
Figure 3.
Figure 3.
SNARE-syntaxin network expanded by predicted interactions. Proteins with known, experimentally determined interactions (blue lines) from the BIND dataset formed an initial set. This was expanded one layer outwards by identifying all proteins that are predicted to interact with proteins from the initial set. All predicted interactions are rated by CV (line thickness) and coexpression (line color). Nodes are color coded with predicted subcellular localizations and sized according to the number of predicted interacting protein partners throughout the entire predicted interactome. Note that the interaction between OSM1 and VTI12 is both predicted and experimentally determined (both red and blue lines connect these nodes).
Figure 4.
Figure 4.
Subcellular localization of protein interactions. A, A network subset of medium confidence interacting proteins where proteins were assigned to a subcellular compartment in the SUBA database. B, Analysis of all interacting protein pairs in which both partners were assigned to a subcellular compartment. The numbers of individual protein numbers is in italics beside compartment names. Compartment pairs that showed enriched or depleted numbers of interactions (compared to chance) are color coded. For example, there is a significant (P < 0.01) enrichment of interactions in which both partners are nuclear localized, while there is a significant depletion of interactions between nuclear and vacuolar localized proteins. Chloro, Chloroplast; Cyskel, cytoskeleton; Excell, extracellular; Mito, mitochondria; Perox, peroxisome.
Figure 5.
Figure 5.
Coexpression of interologs. A, The PCC for 19,979 predicted interaction pairs was calculated and plotted as the number of pairs in each Pearson correlation coefficient range, with an r unit bin size of 0.1 (blue points). The correlation coefficient calculation was also performed for 20,000 randomly selected pairs of Arabidopsis genes from within our interactome (green points), from all AGI IDs on the ATH1 GeneChip (red points), or from all AGI IDs on the ATH1 GeneChip such that the topology of the random network was the same as that of our predicted interactome (magenta points). Note that not all gene pairs mapped to probe sets on the Affymetrix ATH1 Gene Chip. The gene expression set used is an compendium of the four smaller AtGenExpress compendia displayed in the Expression Browser tool at http://bbc.botany.utoronto.ca. These include data sets generated by Schmid et al. (2005), Kilian et al. (2007), and other members of the AtGenExpress consortium. Genes with a high PCC are considered to be coexpressed. The interolog distribution is shown to contain many coexpressed pairs. B, The interolog CV was plotted against the correlation coefficient for each pair, demonstrating that a high confidence score (score ≥ 11) may suggest that the interolog pair is coexpressed. Significant values (P < 0.05) lie above and below the dotted lines. [See online article for color version of this figure.]
Figure 6.
Figure 6.
Interolog database and integration with BAR Expression Browser output. A, The top 32 interologs were displayed in the output of a query on the Schmid et al. (2005) data set as present in the BAR (Toufighi et al., 2005). The left arrow highlights the expression clustering results, indicating high degrees of coexpression, while the loops joining two AGI identifiers highlighted by the right arrow denote interolog pairs. The color of the loop indicates the interolog CV. The AGI identifiers are colored according to their biological functions: light green, transcription initiation; dark green, DNA mismatch repair; light blue, pyruvate dehydrogenase E1a and E1b subunits; dark blue, proteosomal complex components; magenta, spliceosomal components; orange, DNA replication; white, unknown. B, Clicking on the interolog loops in the above output will open an output window for an Arabidopsis Interaction Viewer query, providing more detailed information on the predicted and experimentally identified interactions present in the database.

Similar articles

Cited by

References

    1. Bader GD, Betel D, Hogue CWV (2003) BIND: the biomolecular interaction network database. Nucleic Acids Res 31 248–250 - PMC - PubMed
    1. Bader GD, Donaldson I, Wolting C, Ouellette BFF, Pawson T, Hogue CWV (2001) BIND—the biomolecular interaction network database. Nucleic Acids Res 29 242–245 - PMC - PubMed
    1. Bandyopadhyay S, Sharan R, Ideker T (2006) Systematic identification of functional orthologs based on protein network comparison. Genome Res 16 428–435 - PMC - PubMed
    1. Batada NN, Reguly T, Breitkreutz A, Boucher L, Breitkreutz BJ, Hurst LD, Tyers M (2006) Stratus not altocumulus: a new view of the yeast protein interaction network. PLoS Biol 4 1720–1731 - PMC - PubMed
    1. Bhardwaj N, Lu H (2005) Correlation between gene expression profiles and protein-protein interactions within and across genomes. Bioinformatics 21 2730–2738 - PubMed

Publication types

Substances