. 2007 Aug;50(4):1048-62.
doi: 10.1044/1092-4388(2007/073).

Will they catch up? The role of age at cochlear implantation in the spoken language development of children with severe to profound hearing loss

Affiliations

Will they catch up? The role of age at cochlear implantation in the spoken language development of children with severe to profound hearing loss

Johanna Grant Nicholas et al. J Speech Lang Hear Res. 2007 Aug.

Abstract

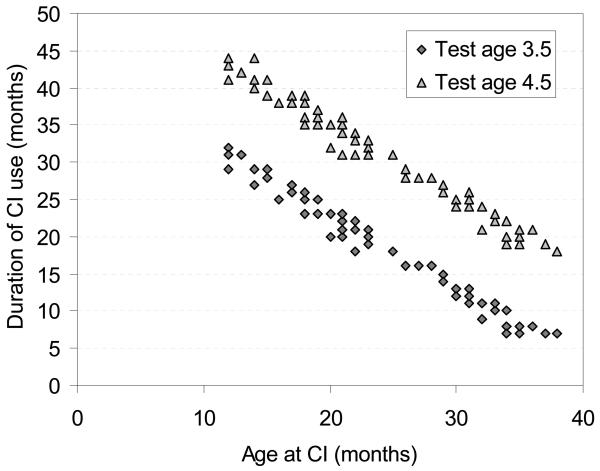
Purpose: The authors examined the benefits of younger cochlear implantation, longer cochlear implant use, and greater pre-implant aided hearing to spoken language at 3.5 and 4.5 years of age.

Method: Language samples were obtained at ages 3.5 and 4.5 years from 76 children who received an implant by their 3rd birthday. Hierarchical linear modeling was used to identify characteristics associated with spoken language outcomes at the 2 test ages. The Preschool Language Scale (I. L. Zimmerman, V. G. Steiner, & R. E. Pond, 1992) was used to compare the participants' skills with those of hearing age-mates at age 4.5 years.

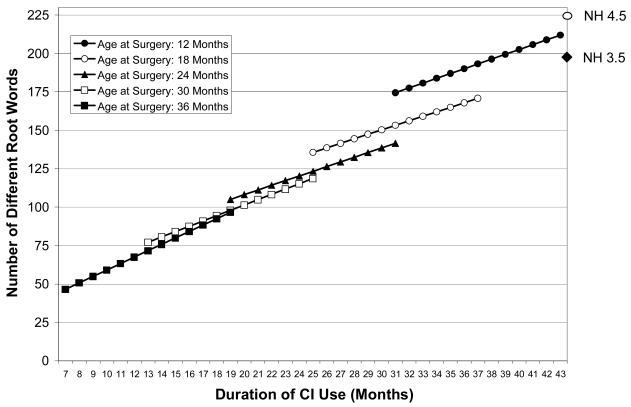
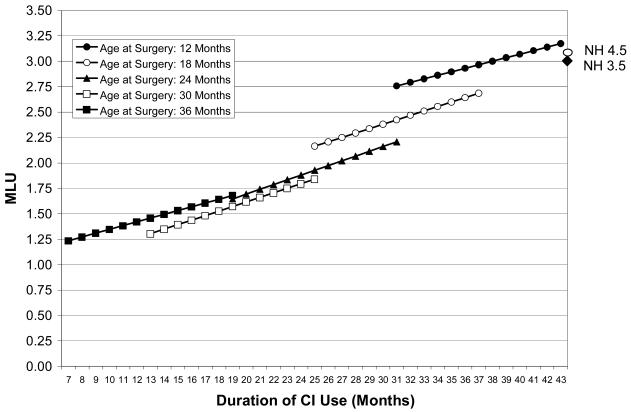
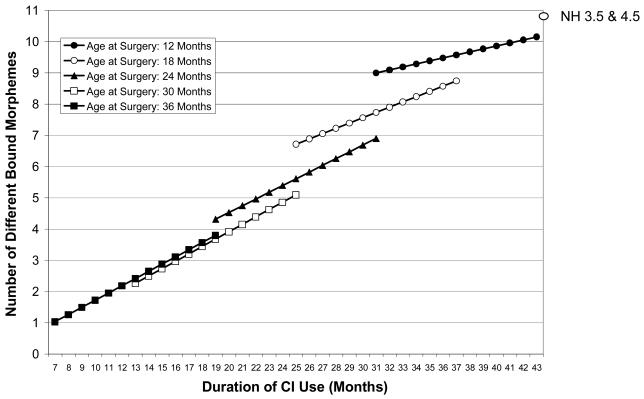
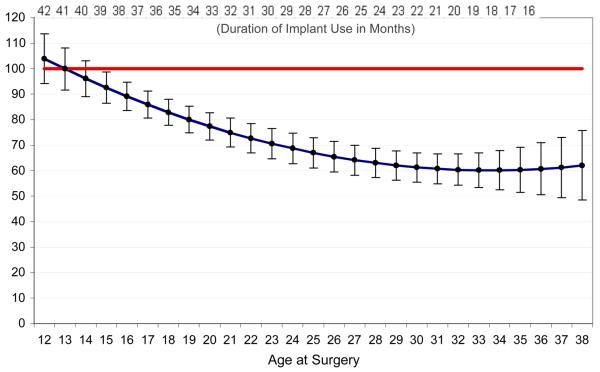
Results: Expected language scores increased with younger age at implant and lower pre-implant thresholds, even when compared at the same duration of implant use. Expected Preschool Language Scale scores of the children who received the implant at the youngest ages reached those of hearing age-mates by 4.5 years, but those children implanted after 24 months of age did not catch up with hearing peers.

Conclusion: Children who received a cochlear implant before a substantial delay in spoken language developed (i.e., between 12 and 16 months) were more likely to achieve age-appropriate spoken language. These results favor cochlear implantation before 24 months of age, especially for children with aided pure-tone average thresholds greater than 65 dB prior to surgery.


Figures

Figure 1
Figure 1
The relation between age at implant and duration of implant experience at each test session.
Figure 2
Figure 2. Number of Different Words
Each figure shows, for selected surgery ages, the relationship between duration of implant use and an outcome variable. These figures were derived in the following way. For a given surgery age and assuming the grand mean for pre-implant aided threshold, a duration slope and intercept were calculated from the HLM equations (see Tables 4 and 5). These were obtained by multiplying the appropriate Level 2 coefficients by the particular surgery age (as a deviation from the group mean of 21 months) or its square (pre-implant aided threshold was centered at its grand mean and so assumed a value of 0 in these calculations). The duration centering constant is 24 months, representing two years of use. By using these centering constants, the Level 1 constant and slope coefficients are the expected values for a subject with a median surgery age. The constant is further the expected outcome for a participant with a median surgery age and two years of implant use. The resulting surgery-age-specific slope and intercept coefficients were then used to generate the predicted outcomes for different values of duration (a range of duration values were selected that were typical for the particular surgery age). The resulting figures thus show the expected outcome values given different surgery ages and durations of implant use.
Figure 3
Figure 3. Mean Length of Utterance
Each figure shows, for selected surgery ages, the relationship between duration of implant use and an outcome variable. These figures were derived in the following way. For a given surgery age and assuming the grand mean for pre-implant aided threshold, a duration slope and intercept were calculated from the HLM equations (see Tables 4 and 5). These were obtained by multiplying the appropriate Level 2 coefficients by the particular surgery age (as a deviation from the group mean of 21 months) or its square (pre-implant aided threshold was centered at its grand mean and so assumed a value of 0 in these calculations). The duration centering constant is 24 months, representing two years of use. By using these centering constants, the Level 1 constant and slope coefficients are the expected values for a subject with a median surgery age. The constant is further the expected outcome for a participant with a median surgery age and two years of implant use. The resulting surgery-age-specific slope and intercept coefficients were then used to generate the predicted outcomes for different values of duration (a range of duration values were selected that were typical for the particular surgery age). The resulting figures thus show the expected outcome values given different surgery ages and durations of implant use.
Figure 4
Figure 4. Number of Different Bound Morphemes
Each figure shows, for selected surgery ages, the relationship between duration of implant use and an outcome variable. These figures were derived in the following way. For a given surgery age and assuming the grand mean for pre-implant aided threshold, a duration slope and intercept were calculated from the HLM equations (see Tables 4 and 5). These were obtained by multiplying the appropriate Level 2 coefficients by the particular surgery age (as a deviation from the group mean of 21 months) or its square (pre-implant aided threshold was centered at its grand mean and so assumed a value of 0 in these calculations). The duration centering constant is 24 months, representing two years of use. By using these centering constants, the Level 1 constant and slope coefficients are the expected values for a subject with a median surgery age. The constant is further the expected outcome for a participant with a median surgery age and two years of implant use. The resulting surgery-age-specific slope and intercept coefficients were then used to generate the predicted outcomes for different values of duration (a range of duration values were selected that were typical for the particular surgery age). The resulting figures thus show the expected outcome values given different surgery ages and durations of implant use.
Figure 5
Figure 5
PLS Expressive Standard Scores at Test Session 2 by Age at Implant

References

    1. Battmer RD, Gupta SP, Allum-Mecklenburg DJ, Lenarz T. Factors influencing cochlear implant perceptual performance in 132 adults. Annals of Otology, Rhinology & Laryngology. 1995;166:S185–S187. - PubMed
    1. Bellaire S, Plante E, Swisher L. Bound morpheme skills in the oral language of school-age, language-impaired children. Journal of Communication Disorders. 1994;27:265–279. - PubMed
    1. Connor CM, Hieber S, Arts HA, Zwolan TA. Speech, vocabulary, and the education of children using cochlear implants: Oral or total communication? Journal of Speech, Language, and Hearing Research. 2000;43:1185–1204. - PubMed
    1. Dolan-Ash S, Hodges AV, Butts SL, Balkany TJ. Borderline pediatric cochlear implant candidates: Preoperative and postoperative results. Annals of Otology, Rhinology & Laryngology. 2000;109:36–38. - PubMed
    1. Dunn LM, Dunn LM. The Peabody Picture Vocabulary Test. 3rd ed. American Guidance Service; Circle Pines, MN: 1997.

Publication types