. 2007 Sep;14(9):796-806.
doi: 10.1038/nsmb1280. Epub 2007 Aug 5.

In vivo dynamics of RNA polymerase II transcription

Affiliations

In vivo dynamics of RNA polymerase II transcription

Xavier Darzacq et al. Nat Struct Mol Biol. 2007 Sep.

Abstract

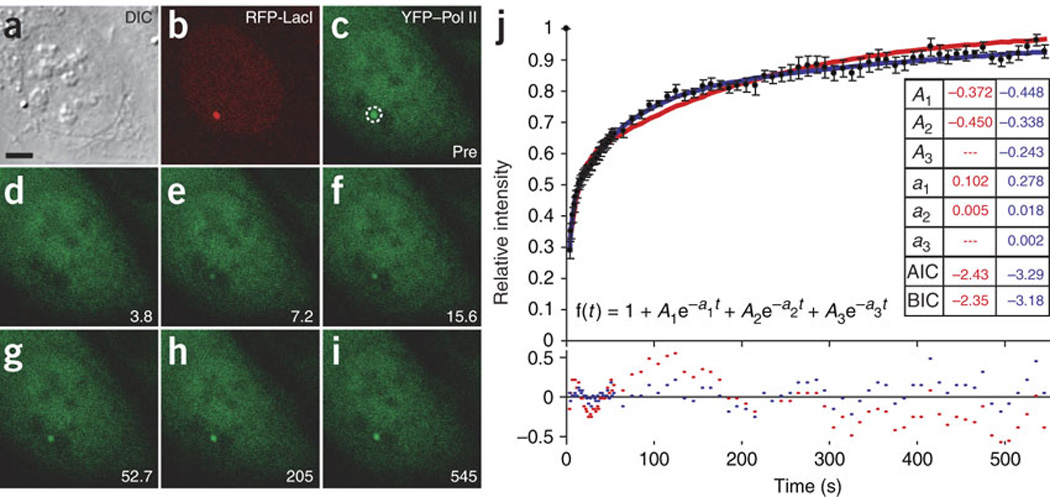
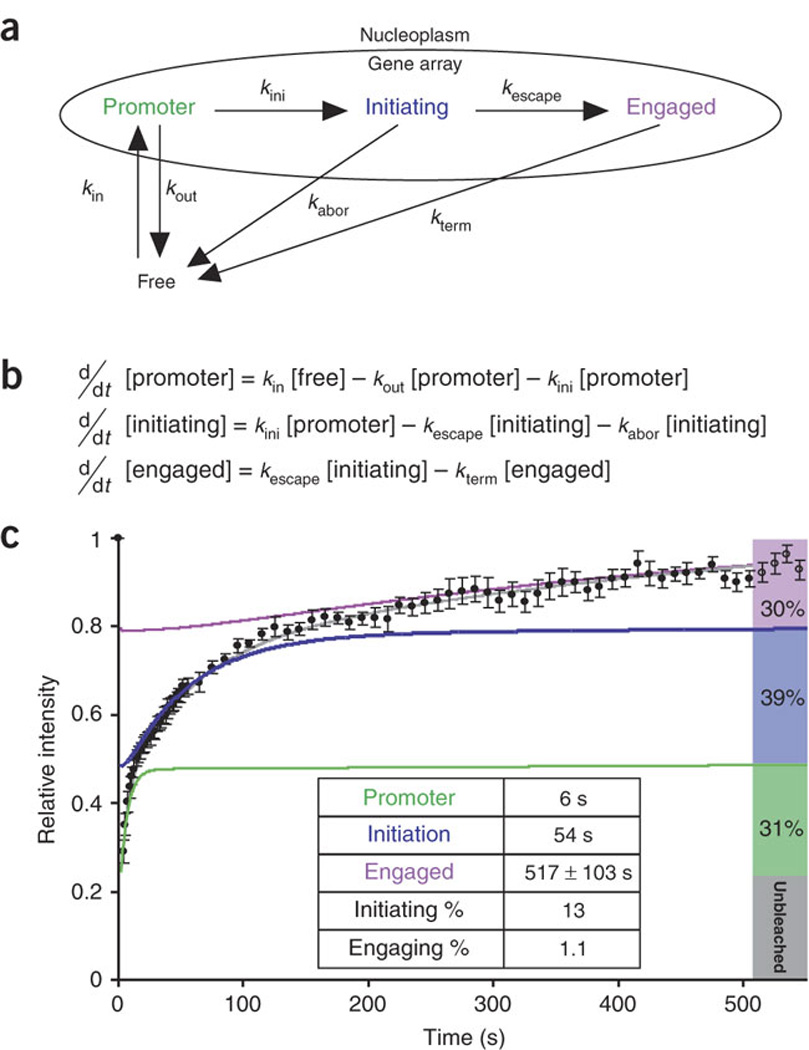
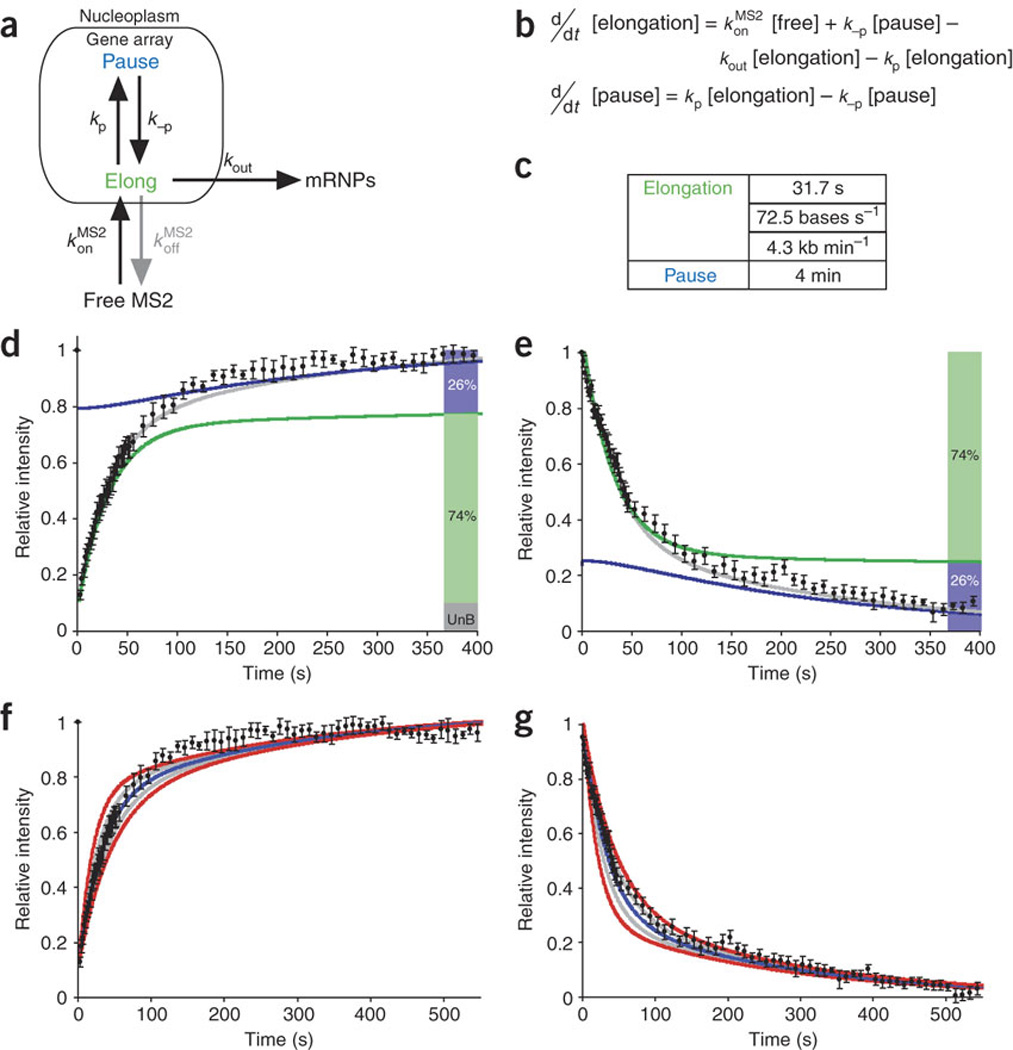
We imaged transcription in living cells using a locus-specific reporter system, which allowed precise, single-cell kinetic measurements of promoter binding, initiation and elongation. Photobleaching of fluorescent RNA polymerase II revealed several kinetically distinct populations of the enzyme interacting with a specific gene. Photobleaching and photoactivation of fluorescent MS2 proteins used to label nascent messenger RNAs provided sensitive elongation measurements. A mechanistic kinetic model that fits our data was validated using specific inhibitors. Polymerases elongated at 4.3 kilobases min(-1), much faster than previously documented, and entered a paused state for unexpectedly long times. Transcription onset was inefficient, with only 1% of polymerase-gene interactions leading to completion of an mRNA. Our systems approach, quantifying both polymerase and mRNA kinetics on a defined DNA template in vivo with high temporal resolution, opens new avenues for studying regulation of transcriptional processes in vivo.


Figures

Figure 1
Figure 1. Detecting transcription in vivo using fluorescence microscopy
(a) Schematic of the gene cassette stably integrated into chromosomes of human U2OS cells. P above protein sequence denotes Pol II phosphorylation state (red, phosphorylated). Reverse tet transactivator (rtTA) in the presence of doxycycline drives gene expression from a minimal CMV promoter. Arrows indicate the 3.3-kb region transcribed by Pol II and the 2.3-kb region labeled by GFP-MS2 fusion proteins. Red lines indicate targets of FISH oligonucleotide probes. (b–m) Active transcription sites recruit Pol II. In b,e,h,k, RFP-LacI labels gene locus. Immunofluorescence (using indicated antibodies) reveals Pol II in three phosphorylation states: unphosphorylated (c), phosphorylated at Ser5 (f) and phosphorylated at Ser2 (i). l shows that the transcription site recruits YFP–Pol II (YFP-RPB1αAmr). In n–y, nascent mRNAs were detected at active sites. In n,r,v, CFP-LacI labels gene locus. In o,s, mRNAs bound by GFP-MS2 were detected by FISH (probes at 5' and 3' ends are shown in p,t). FISH signals at exon (w) and intron regions (x) colocalize only at transcription site (see merge of each row, q,u,y). Scale bars, 5 µm.
Figure 2
Figure 2. Quantifying Pol II transcription kinetics in vivo
Fluorescence recovery after photobleaching of the transcription site is shown in a–i. (a) Differential interference contrast images of live cells. (b) RFP-LacI labels gene locus. (c) Dashed circle indicates photobleached region. (d–i) Bleaching (d) and recovery (e–i) of YFP–Pol II at active site, monitored for 545 s. Scale bar, 5 µm. (j) Pol II FRAP data (black; n = 10) fit to a sum of exponentials (see equation) to determine the minimal model complexity. This was done using generalized least-squares optimization as implemented in the SAAM II software package (http://depts.washington.edu/saam2/). Goodness of fit was evaluated by requiring that coefficients of variation on the parameter estimates were less than 30% and by checking for a random distribution of residuals around 0 (red and blue dots in lower chart represent residuals for two and three exponentials, respectively). By these criteria, a fit of the Pol II FRAP data requires three exponentials (blue), as residuals are not randomly distributed when fit to two exponentials (red). The Akaike information criterion (AIC) and the Bayes-Schwarz information criterion (BIC) for two- and three-exponential models are reported in the inset table. These standard quantitative measures of goodness-of-fit penalize additional model parameters. If the fit is sufficiently improved to justify the increased complexity of the model, then the AIC and BIC of the more complex model will be less than those of the simpler model. By this measure, three exponentials are superior to two in modeling our data. Error bars show s.e.m.
Figure 3
Figure 3. Polymerase II mechanistic kinetic model used to simulate the data
(a) Arrows labeled with rate constants represent transitions. (b) Differential equations simulating the mechanistic model in a, used to analyze the data in c. (c) Normalized fluorescence recovery of YFP–Pol II after photobleaching (black dots; data are the same as in Fig. 2j). The best-fit solution for the mathematical model (gray) characterizes three kinetically distinct states of Pol II (green, blue and purple, respectively) and predicts the steady-state fraction accumulating in each state (right bars). Inset table lists residence times for each state and probabilities for each step derived from the model in a and equations in b.
Figure 4
Figure 4. Diffusion is not a significant factor in the Pol II kinetic model
(a) FRAP was measured for YFP–Pol II in the nucleoplasm, where the local concentration of genes is lower than at the gene array. During 40 s of recovery, we observed only the diffusing population of polymerases (60% of the recovery signal; black dots). This component was fit with a kinetic rate constant (kdif) to describe the influx and efflux of molecules with respect to the nucleoplasmic bleached regions (gray curve). We also plotted the transcription site (TS) kinetic components for comparison. The fastest component (green) corresponds to a residence time of 6 s. The intermediate component (blue) is an order of magnitude slower, and the elongating polymerase (purple) is an order of magnitude slower still, as a fixed fraction near 0 was seen on this timescale. Error bars show s.e.m.; n = 5. (b) FRAP of YFP–Pol II was monitored for 2.5 min at the transcription site using four different bleached areas and measuring the recovery of the central transcription site. Spot sizes ranged from 3 µm2 (12 times the area of a typical active transcription site) to 25 µm2 (100 times the area of a typical transcription site). Superimposition of these curves demonstrated that the recovery rates we measured are independent of spot size and enabled us to disregard diffusion in our model. Error bars show s.e.m.
Figure 5
Figure 5. The transcription inhibitor DRB specifically affects the slow component
(a) Data from confocal microscopy (green squares, data from Fig. 2j, with curve (upper blue line) showing three-exponential fit using kinetic parameters from Fig. 2j) and three-dimensional wide-field microscopy (gray squares; n= 13) yield similar kinetics. YFP–Pol II kinetics in cells treated with the transcription elongation inhibitor DRB (black dots; n = 5) were fit using the same kinetic parameters, but engaged residence time was increased to an infinite value. The resulting curve (lower blue line) demonstrate that the slow component is dependent on elongation. Error bars show s.e.m. (b) Modeling the goodness of fit for the Pol II component. Errors of ± 20% (gray) or ± 40% (red) modeled to demonstrate the accuracy of the best-fit curve (blue) from which the rate constants are derived. As the data fall within the 20% error curves, we determined a residence time of 517 ± 103 s (20% error) for the slow component (Fig. 3c; black dots show same data as in Fig. 2j).
Figure 6
Figure 6. Quantifying mRNA synthesis in vivo
(a–s) FRAP (a–i) and loss of fluorescence after photoactivation (k–s) at the transcription site of the MS2-labeled mRNA. a,k show differential interference contrast images of live cells. In b,l, RFP-LacI labels gene locus. In c,m, dotted circle indicates photobleached and photoactivated regions, respectively. d,n show bleached MS2-GFP and activated paGFP-MS2, respectively. e–i show MS2-GFP recovery and o–s show paGFP-MS2 release from transcription site monitored for 10 min. Scale bars, 5 µm. (j,t) Normalized locus recovery (j) or loss in fluorescence (t) (black dots; n = 10). Curves show best-fit solutions for mathematical model (see equation) with single exponential (red) or two exponentials (blue), and inset tables list the resulting parameters (also see residuals in lower chart) along with the Akaike information criterion (AIC) and the Bayes-Schwarz information criterion (BIC). See Figure 2 for details. Both data sets require two exponentials, as the residuals are not randomly distributed with one exponential. When the MS2 photoactivation data (t) are fit to a single-exponential function, all the residuals for t < 200 s are negative and all those for t > 200 s are positive. If the two fits (j and t) are constrained to use the same Eigen values, the resulting mean residence times are 238 s and 34 s (see also Table 1). Error bars show s.e.m.
Figure 7
Figure 7. Modeling the kinetics of elongation during mRNA synthesis
(a) Model of mRNA synthesis with two states, elongation and pausing, corresponding to kinetic parameters derived independently from Figure 6j,t. Arrows labeled with rate constants represent transitions. mRNPs, messenger ribonucleoprotein particles. (b) Differential equations corresponding to the model. (c) Residence times for each state. (d,e) Fits of the data from Figure 6 to this mathematical model. Shaded bars at right indicate fraction of mRNA in each state (UnB, unbleached fraction). Gray curve is best fit. (f,g) Assessment of errors for best-fit curves in d,e, as in Figure 5b.
Figure 8
Figure 8. Simulations of RNA synthesis curve fitting to test the effects of different pausing percentages and residence times on our model
(a,b) Different elongation speeds ranging from 1 to 5 kb min−1 were simulated to illustrate that slower elongation speeds are inconsistent with our FRAP and photoactivation data. Data in a,b (black dots) are the same as in Figure 6j,t, respectively. (c) Best-fit solution predicts that a small fraction of polymerases (4.2% in our solution) enter long pauses; here we explored situations where different amounts of polymerases are forced to pause, ranging from 0% (dark blue) to 90% (green). A nonpausing system is simulated by a single-exponential fast decay, and increasing percentages of pausing allow the slow decay to dominate the simulation, gradually becoming the predominant population at the locus. This demonstrates that our model depends on only a small fraction of the polymerases pausing. Data (black dots) are the same as in Figure 6t. (d) Curves based on different pausing times illustrate that although our data (black dots; same as in Fig. 6t) cannot distinguish small differences in pausing time, larger variations are inconsistent with the data.
Figure 9
Figure 9. Drugs that inhibit elongation affect the kinetics of RNA synthesis in specific ways
Drugs were added to doxycycline-activated cells and GFP-MS2 transcription sites were photobleached. (a) Fluorescence recovery after actinomycin D treatment (5 µg ml−1) for 20 min resulted in a large immobile fraction, indicating stalling of the polymerase owing to intercalation. (b) Fluorescence recovery in untreated cells (normal) and cells treated with the fast-acting drug camptothecin (14 µM) for 15–45 min (+Cmt), detected with a Zeiss confocal microscope (see Supplementary Methods). Treatment with camptothecin led to a much slower recovery. These data are consistent with the drug causing inhibition of topoisomerase I, so that polymerases can not proceed at full speed owing to torsional stress imposed by the supercoiling of the DNA. Error bars in a,b show s.e.m.

Comment in

References

    1. Moore MJ. From birth to death: the complex lives of eukaryotic mRNAs. Science. 2005;309:1514–1518. - PubMed
    1. Shilatifard A, Conaway RC, Conaway JW. The RNA polymerase II elongation complex. Annu. Rev. Biochem. 2003;72:693–715. - PubMed
    1. Cramer P, Bushnell DA, Kornberg RD. Structural basis of transcription: RNA polymerase II at 2.8 angstrom resolution. Science. 2001;292:1863–1876. - PubMed
    1. Cramer P. RNA polymerase II structure: from core to functional complexes. Curr. Opin. Genet. Dev. 2004;14:218–226. - PubMed
    1. Krumm A, Hickey LB, Groudine M. Promoter-proximal pausing of RNA polymerase II defines a general rate-limiting step after transcription initiation. Genes Dev. 1995;9:559–572. - PubMed

Publication types