. 2007 Aug 28;46(34):9752-61.
doi: 10.1021/bi700574n. Epub 2007 Aug 3.

Effects of PKA phosphorylation of cardiac troponin I and strong crossbridge on conformational transitions of the N-domain of cardiac troponin C in regulated thin filaments

Affiliations

Effects of PKA phosphorylation of cardiac troponin I and strong crossbridge on conformational transitions of the N-domain of cardiac troponin C in regulated thin filaments

Wen-Ji Dong et al. Biochemistry. .

Abstract

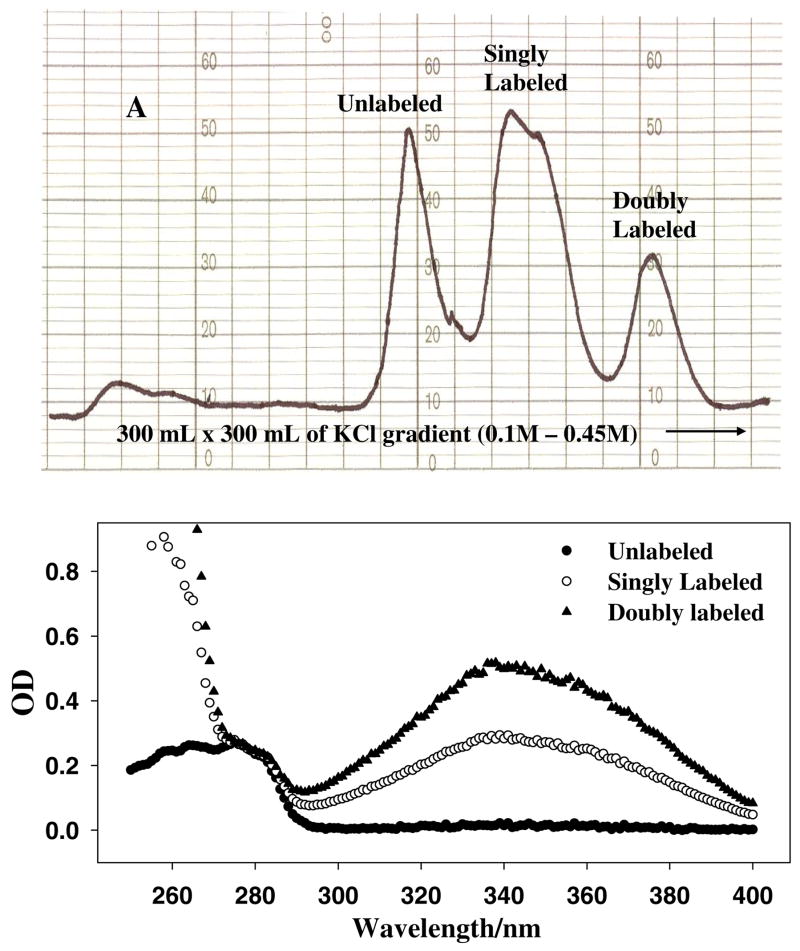
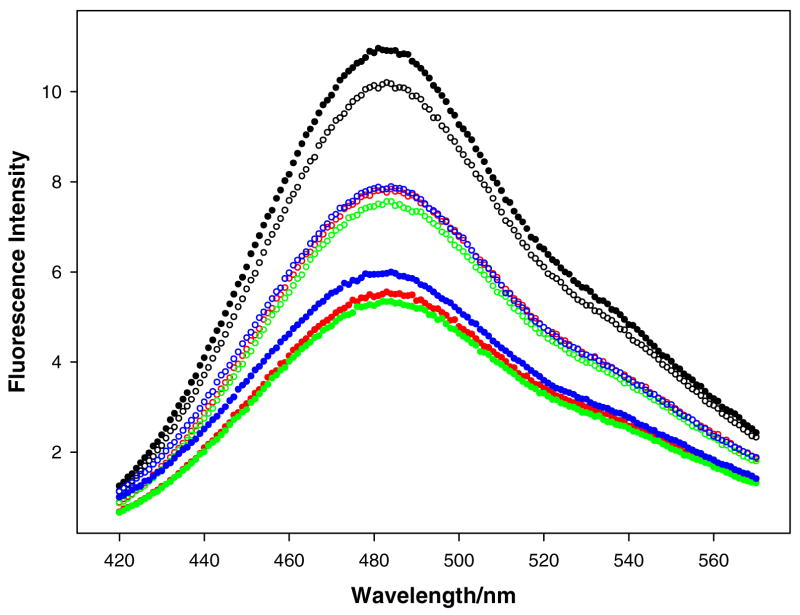
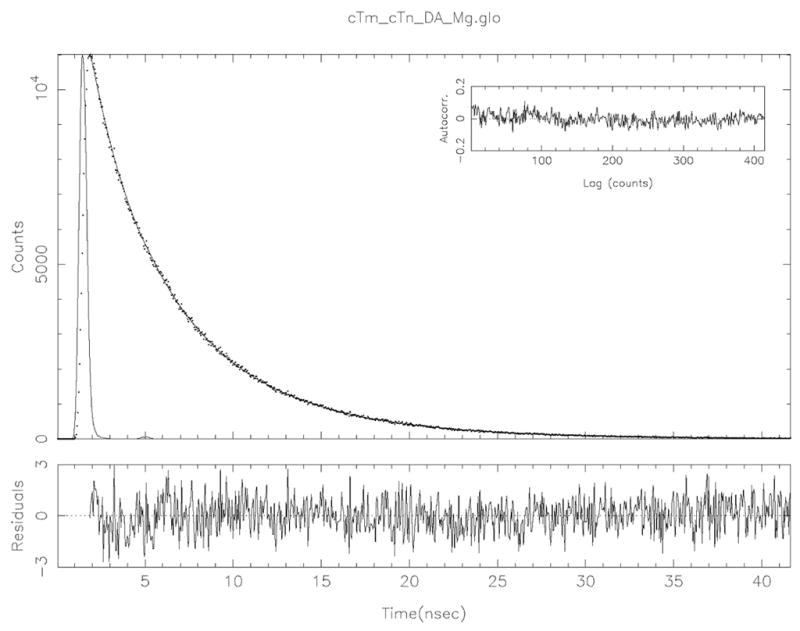
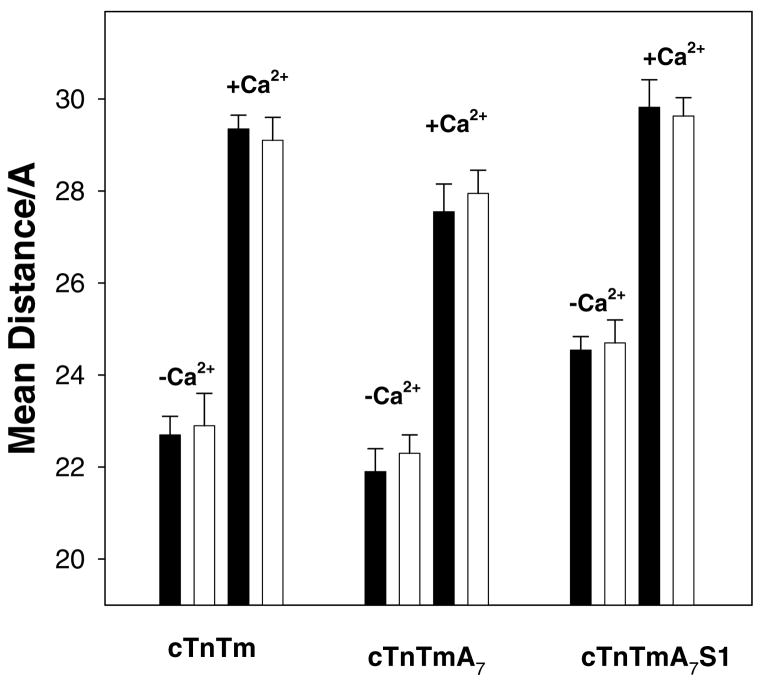
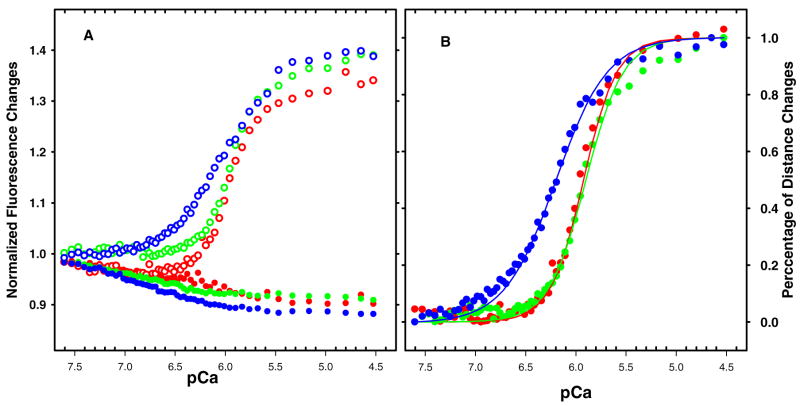
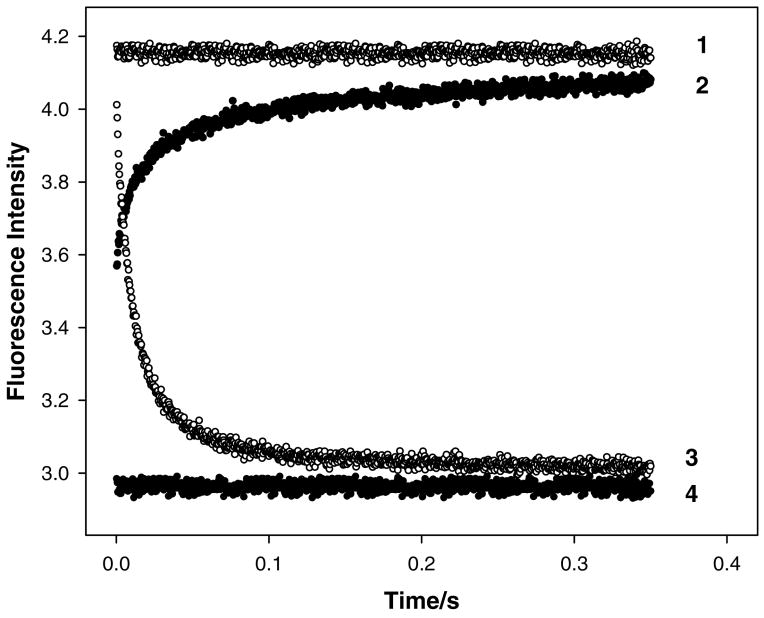
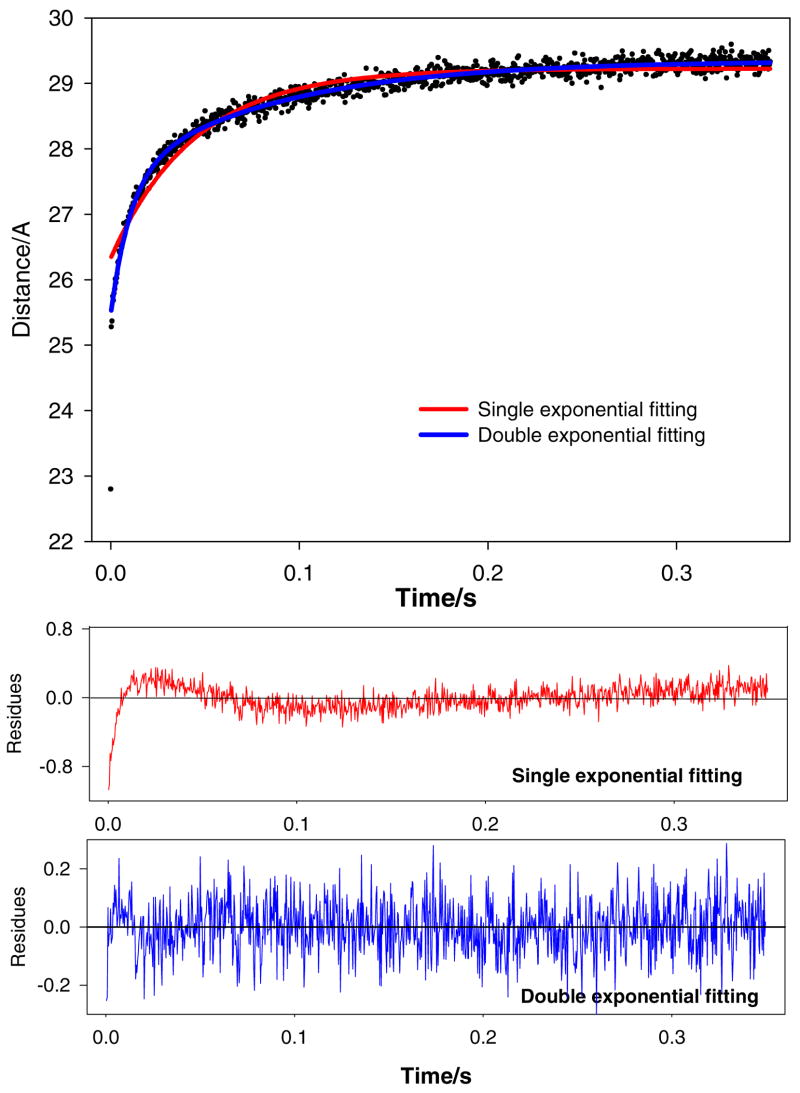
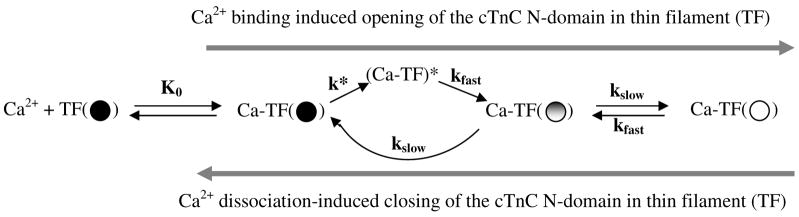
Regulation of cardiac muscle function is initiated by binding of Ca2+ to troponin C (cTnC) which induces a series of structural changes in cTnC and other thin filament proteins. These structural changes are further modulated by crossbridge formation and fine-tuned by phosphorylation of cTnI. The objective of the present study is to use a new Förster resonance energy transfer-based structural marker to distinguish structural and kinetic effects of Ca2+ binding, crossbridge interaction, and protein kinase A phosphorylation of cTnI on the conformational changes of the cTnC N-domain. The FRET-based structural marker was generated by attaching AEDANS to one cysteine of a double-cysteine mutant cTnC(13C/51C) as a FRET donor and attaching DDPM to the other cysteine as the acceptor. The doubly labeled cTnC mutant was reconstituted into the thin filament by adding cTnI, cTnT, tropomyosin, and actin. Changes in the distance between Cys13 and Cys51 induced by Ca2+ binding/dissociation were determined by FRET-sensed Ca2+ titration and stopped-flow studies, and time-resolved fluorescence measurements. The results showed that the presence of both Ca2+ and strong binding of myosin head to actin was required to achieve a fully open structure of the cTnC N-domain in regulated thin filaments. Equilibrium and stopped-flow studies suggested that strongly bound myosin head significantly increased the Ca2+ sensitivity and changed the kinetics of the structural transition of the cTnC N-domain. PKA phosphorylation of cTnI impacted the Ca2+ sensitivity and kinetics of the structural transition of the cTnC N-domain but showed no global structural effect on cTnC opening. These results provide an insight into the modulation mechanism of strong crossbridge and cTnI phosphorylation in cardiac thin filament activation/relaxation processes.


Figures

Figure 1
Figure 1
Separation and identification of cTnC(13C/51C) labeled with AEDANS. A: Elution profile of labeled protein from a DEAE column with a KCl gradient (see Materials and Methods). Identities of the three separated peaks were established by absorption measurements of AEDANS. The singly labeled species had one cysteine labeled, and the doubly labeled species had both cysteine labeled. B: Absorption spectra of the unlabeled, singly labeled and doubly labeled species separated from the DEAE column. The spectra were normalized at 285 nm (protein absorption). The broad absorption bands centered at 343 nm was from AEDANS.
Figure 2
Figure 2
Steady-state FRET measurements of the complexes containing donor and donor-acceptor modified cTnC(13C/51C) mutant in the absence of Ca2+ (solid circle), and in the presence of Ca2+ (open circle). Black curves, donor-only sample of cTnTm; red curves, donor-acceptor sample of cTnTm; green curves, donor-acceptor sample of cTnTmA7; and blue curves, donor-acceptor sample of cTnTmA7S1.
Figure 3
Figure 3
Intensity decay of FRET donor AEDANS in the presence of acceptor DDPM in cTnC determined with the cTnTm complex in the absence of bound Ca2+. The sharp on the left is the excitation light pulse. The decay data were fitted to a bi-exponential function. The goodness of fit is indicated by the residual plot (bottom) and autocorrelation function (inset).
Figure 4
Figure 4
Mean distances between residues 13 and 51 of cTnC in the different complexes and in the absence and presence of phosphorylated cTnI. Black bars are results from samples containing non-phosphorylated cTnI, and white bars are results from samples containing phosphorylated cTnI. Error bars are standard deviations from duplicate determinations.
Figure 5
Figure 5
FRET equilibrium Ca2+ titration of distance between residues 13 and 51 of cTnC in cTnTm (red), cTnTmA7 (green), and cTnTmA7S1 (blue) with non-phosphorylated cTnI. Fluorescence intensity is normalized to the intensity of the donor-only sample determined in pCa 7.4. A: Normalized fluorescence intensity changes of the donor-only samples (solid circle), and donor-acceptor samples (open circle) vs. pCa. B: Normalized distance changes vs. pCa.. Titration curves were fitted with the Hill equation (solid lines) to determine pCa50 and the Hill coefficient. The parameters are listed in Table 1.
Figure 6
Figure 6
Stopped-flow tracings of FRET donor fluorescence intensity in cTnC reconstituted into cTnTmA7 containing cTnC(13C/N51C)AEDANS-DDPM. (1) Baseline for Ca2+ dissociation experiment; (2) Ca2+ binding-induced tracing obtained by rapidly mixing sample with Ca2+; (3) Ca2+ dissociation-induced tracing obtained by rapidly mixing a Ca2+-saturated sample with EGTA; and (4) baseline for Ca2+ binding experiment.
Figure 7
Figure 7
Stopped-flow tracings of distance changes between residues 13 and 51 of cTnC in cTnTm complex induced by Ca2+ binding. Upper panel, Ca2+ binding-induced distance tracing. The initial unresolved very fast transition (about 45% of total signal change) was lost in the mixing time. The remaining decay was fitted with a single exponential function (red) and a two-exponential function (blue). Middle panel, residual plot for the single exponential fit. Lower panel, residual plot for the two-exponential fit. The residual plots suggest that the two-exponential fit is adequate. The best fitted parameters are listed in Table 2.
Scheme
Scheme

References

    1. Ebashi S, Endo M. Calcium ion and muscle contraction. Prog Biophys Mol Biol. 1968;18:123–183. - PubMed
    1. Farah CS, Reinach FC. The troponin complex and regulation of muscle contraction. FASEB J. 1995;9:755–767. - PubMed
    1. Gordon AM, Homsher E, Regnier M. Regulation of contraction in striated muscle. Physiol Rev. 2000;80:853–924. - PubMed
    1. Dong WJ, Xing J, Villain M, Hellinger M, Robinson JM, Chandra M, Solaro RJ, Umeda PK, Cheung HC. Conformation of the regulatory domain of cardiac muscle troponin C in its complex with cardiac troponin I. J Biol Chem. 1999;274:31382–31390. - PubMed
    1. Li MX, Spyracopoulos L, Sykes BD. Binding of cardiac troponin-I147–163 induces a structural opening in human cardiac troponin-C. Biochemistry. 1999;38:8289–8298. - PubMed

Publication types