. 2007 Aug 3;3(8):e107.
doi: 10.1371/journal.ppat.0030107.

Epigenetic silencing of Plasmodium falciparum genes linked to erythrocyte invasion

Affiliations

Epigenetic silencing of Plasmodium falciparum genes linked to erythrocyte invasion

Alfred Cortés et al. PLoS Pathog. .

Abstract

The process of erythrocyte invasion by merozoites of Plasmodium falciparum involves multiple steps, including the formation of a moving junction between parasite and host cell, and it is characterised by the redundancy of many of the receptor-ligand interactions involved. Several parasite proteins that interact with erythrocyte receptors or participate in other steps of invasion are encoded by small subtelomerically located gene families of four to seven members. We report here that members of the eba, rhoph1/clag, acbp, and pfRh multigene families exist in either an active or a silenced state. In the case of two members of the rhoph1/clag family, clag3.1 and clag3.2, expression was mutually exclusive. Silencing was clonally transmitted and occurred in the absence of detectable DNA alterations, suggesting that it is epigenetic. This was demonstrated for eba-140. Our data demonstrate that variant or mutually exclusive expression and epigenetic silencing in Plasmodium are not unique to genes such as var, which encode proteins that are exported to the surface of the erythrocyte, but also occur for genes involved in host cell invasion. Clonal variant expression of invasion-related ligands increases the flexibility of the parasite to adapt to its human host.


Conflict of interest statement

Competing interests. The authors have declared that no competing interests exist.

Figures

Figure 1
Figure 1. Microarray Comparison of Expression of Invasion-Related Genes between 3D7-A and 3D7-B Schizonts
Values correspond to the ratio of expression in 3D7-A versus 3D7-B. Values for each parasite line are the average of two experiments.
Figure 2
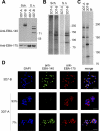
Figure 2. Analysis of EBA-140 in 3D7-A and 3D7-B
(A) Western blot analysis of schizonts extracts (Sch.) or culture supernatants (S.n.) probed with rat anti-EBA-140 antibodies. The same membrane was re-probed with rabbit anti-EBA-175 antibodies to control for the amount of stage-specific material. The position of SeeBlue Plus2 pre-stained standards (Invitrogen) is shown (kDa). (B) Immunoprecipitation of NP-40-extracted schizonts and culture supernatants with anti-EBA-140 antibodies. The position of Precision Plus All Blue pre-stained standards (Bio-Rad, http://www.bio-rad.com/) is shown. (C) Erythrocyte binding assay with radiolabelled supernatants from 3D7-A and 3D7-B. The lane IP corresponds to 3D7-B supernatant immunoprecipitated with anti-EBA-140 antibodies. (D) IFA of 3D7-A and 3D7-B schizonts with rabbit anti-EBA-140 and mouse anti-EBA-175 antibodies. Middle and lower panels are representative of 93% and 7% of EBA-175-positive 3D7-A schizonts, respectively. Scale bar = 5 μm.
Figure 3
Figure 3. Comparison of Proteins Secreted to the Culture Supernatant between 3D7-A and 3D7-B
(A) Radiolabelled culture supernatants run on 20-cm-long 6% SDS-PAGE. The arrows indicate bands present in supernatants from 3D7-A but not from 3D7-B. The arrowhead indicates the band that forms a doublet with the 148-kDa band present only in 3D7-A. (B) Western blot of two lanes identical to those in (A) and run contiguously, probed with rabbit anti-PfRh2b antibodies. (C) Culture supernatants run side by side with identical supernatants immunoprecipitated with the monoclonal antibody 61.3 against RhopH2 (lanes IP). The position of the three members of the RhopH complex is indicated. (D) RT-PCR analysis of clag3.1 and clag3.2 in RNAs from 3D7-A and 3D7-B schizonts.
Figure 4
Figure 4. Expression of Invasion-Related Genes in Subclones of 3D7-A
(A) Analysis of expression of the rhoph1/clag family. Top, silver staining of RhopH components in concentrated, Albumax-free culture supernatants from 3D7-A, 3D7-B, and 11 subclones of 3D7-A resolved in 20 cm 6% SDS-PAGE. Middle, RT-PCR analysis from RNA of tightly synchronised schizonts. cDNA samples were the same across the four panels. The single copy rhoph2 gene was used to control the amount of stage-specific cDNA. The intensity of bands in left and right columns cannot be directly compared (in any of the panels) because they correspond to separate experiments. Bottom, same samples as in the top panel analysed by western blot with anti-Clag2 and anti-Clag3.2 antibodies. (B) Analysis of expression of members of the eba family. Top panels, RT-PCR analysis. The single-copy ama1 gene was used to control the amount of stage-specific cDNA. Lower panels, western blot analysis of schizont extracts with rat anti-EBA-140 antibodies. The same membranes were probed with rabbit anti-EBA-175 and mouse anti-AMA1 antibodies. (C) RT-PCR analysis of expression of genes of the pfRh family. The timing of expression of these genes is similar to that of ama1; thus, RT-PCR analysis of this gene in (B) controls the amount of stage-specific cDNA. (D) RT-PCR analysis of genes expressed at very different levels between 3D7-A and 3D7-B, and of other members of the acbp gene family: acbp gene in Chromosomes 8 (PF08_0099), 10 (PF10_0015 and PF10_0016), and 14 (PF14_0749). See Text S1 for the control of stage-specific cDNA.
Figure 5
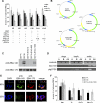
Figure 5. Invasion Phenotypes Associated with the Expression Status of Variantly Expressed Invasion-Related Genes
(A) Invasion phenotype of 3D7-A subclones. Values correspond to percent of invasion into untreated erythrocytes and are the average of three to four independent experiments, with 95% confidence interval. Expression of genes that vary in expression between the subclones is shown underneath. The signs + and − correspond to high or low expression relative to other subclones. N.D., not determined; Nm., neuraminidase; Tr., trypsin; Ch.Tr, chymotrypsin; Nm.+Tr, neuraminidase plus trypsin. (B) Scheme of the plasmids transfected in 3D7-A parasites for the episomal expression of EBA-140. (C) Western blot analysis of schizont extracts, as in Figure 2A. Lanes are 3D7-A, 3D7-B, or 3D7-A parasites transfected with the different plasmids, as indicated. (D) RT-PCR analysis at different stages of the life cycle in 3D7-A (lanes A), 3D7-B (lanes B), and E140-1300-transfected 3D7-A (lanes Atr). The amount of stage-specific cDNA was controlled by amplification of the genes PF13_0275 (rings), PF10_0121 (trophozoites), and ama1 (PF11_0344) (schizonts). (E) IFA of E140-1300-transfected 3D7-A schizonts. Top and lower panels are representative of 65% and 35% of EBA-175-positive schizonts, respectively. The inserts in the top panels are free merozoites. Scale bar = 5 μm. (F) Invasion phenotype of E140-1300-transfected 3D7-A parasites compared to that of 3D7-A and 3D7-B. Values correspond to percent of invasion into untreated erythrocytes and are the average of two independent experiments, with 95% confidence interval.
Figure 6
Figure 6. Southern Blot Analysis of eba-140, clag3.1, and clag3.2 Loci
(A and B) Genomic organization around the loci under study, showing the restriction sites used for Southern blot analysis and the genes annotated in PlasmoDB (block arrows, genes under analysis in grey, neighbours in white). Diagrams are to scale. The scale bar corresponds to 3 kb. Restriction sites are BglII (Bg), HindII (H), AvaII (Av), EcoRI (E), BamHI (B), XmnI (Xm), Asp718 (A), and XbaI (X). The short lines underneath the genes indicate the position of the probes used. (C and D) Southern blot analysis. The probes used were a 1,304-bp BglII-AvaII restriction fragment from the E140–0 plasmid corresponding to the beginning of the eba-140 ORF (C) or a 1:1 mixture of PCR-amplified fragments of about 700 bp corresponding to the beginning of the ORF of clag3.1 and clag3.2 (D). The position of DNA size markers is indicated (kb).
Figure 7
Figure 7. Expression of Genes Located in the Left Subtelomeric Region of Chromosome 13
(A) Schematic of the genes in the left end of Chromosome 13, as annotated in PlasmoDB. Genes above the line are transcribed towards the centromere, whereas genes below the line are transcribed towards the telomere. The genes analysed by RT-PCR are highlighted in grey, with their names. Members of the var, rif, and stevor families are spotted. (B) RT-PCR analysis of RNA from rings, trophozoites, or schizonts of 3D7-A (lanes A) and 3D7-B (lanes B). The cDNA preparations used were the same as in Figure 5D. Thus, the controls for the amount of stage-specific cDNAs in Figure 5D also apply here.
Figure 8
Figure 8. Activation of eba-140 by Insertion of a Drug Resistance Marker in Its Vicinity
(A) Integration of the construct E140–0 (see Figure 5B) into the genomic eba-140 locus. The eba-140 and hdhfr genes are indicated by grey and black block arrows, respectively. The positions of the BglII sites (Bg) and the probe (line underneath the gene) used for the Southern blot analysis are indicated. (B) Southern blot analysis of E140–0 transfected 3D7-A parasites. The lanes correspond to BglII-digested genomic DNA from wild-type 3D7-A (lane WT), 3D7-A transfected with E140–0 before (lane c0) or after two cycles on/off drug (lane c2), and five subclones of the latter (lanes W4–1 to W4–5). The arrow indicates the position of the band for the wild-type gene and the arrowhead the position of the episome (identical to the position of a band obtained by integration of multiple copies of the construct). (C) Western blot analysis (as in Figure 2A) of schizonts extracts of 3D7-A, 3D7-B, and E140–0-transfected 3D7-A parasites before (lane c0) and after two cycles on/off drug (lane c2). (D) RT-PCR analysis of schizonts from subclones that had been maintained for 1 mo either in the absence (lanes −) or the presence (lanes +) of WR99210 drug (increasing concentrations from 10 to 40 nM). The single-copy gene ama1 was used to control the amount of stage-specific cDNA.

References

    1. Aikawa M, Miller LH, Johnson J, Rabbege J. Erythrocyte entry by malarial parasites. A moving junction between erythrocyte and parasite. J Cell Biol. 1978;77:72–82. - PMC - PubMed
    1. Cowman AF, Crabb BS. Invasion of red blood cells by malaria parasites. Cell. 2006;124:755–766. - PubMed
    1. Sim BK, Chitnis CE, Wasniowska K, Hadley TJ, Miller LH. Receptor and ligand domains for invasion of erythrocytes by Plasmodium falciparum . Science. 1994;264:1941–1944. - PubMed
    1. Stubbs J, Simpson KM, Triglia T, Plouffe D, Tonkin CJ, et al. Molecular mechanism for switching of P. falciparum invasion pathways into human erythrocytes. Science. 2005;309:1384–1387. - PubMed
    1. Baum J, Pinder M, Conway DJ. Erythrocyte invasion phenotypes of Plasmodium falciparum in The Gambia. Infect Immun. 2003;71:1856–1863. - PMC - PubMed

Publication types