. 2007 Aug;5(8):e201.
doi: 10.1371/journal.pbio.0050201.

Aging hematopoietic stem cells decline in function and exhibit epigenetic dysregulation

Affiliations

Aging hematopoietic stem cells decline in function and exhibit epigenetic dysregulation

Stuart M Chambers et al. PLoS Biol. 2007 Aug.

Abstract

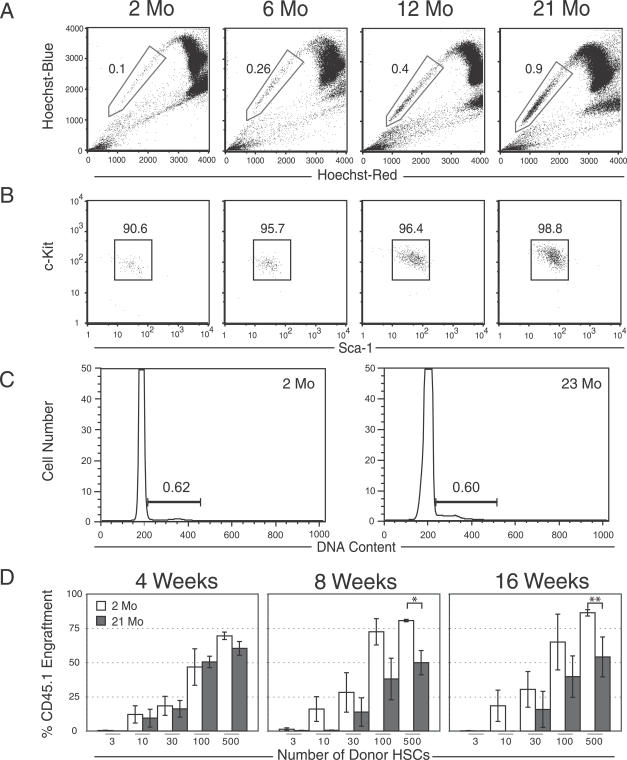
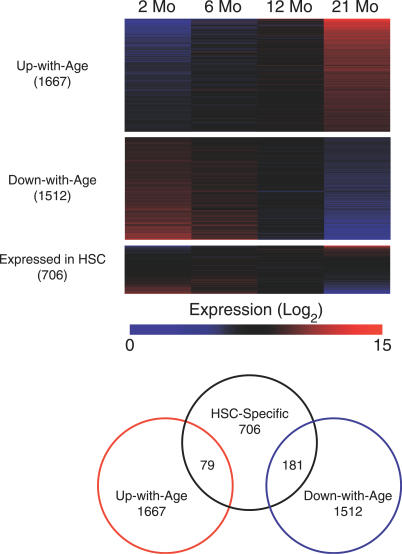
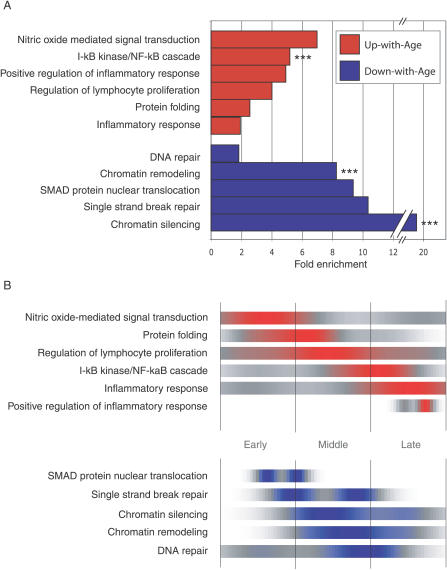
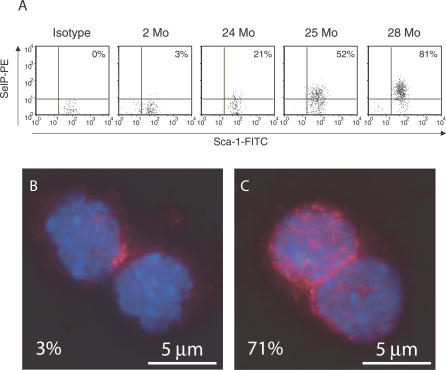
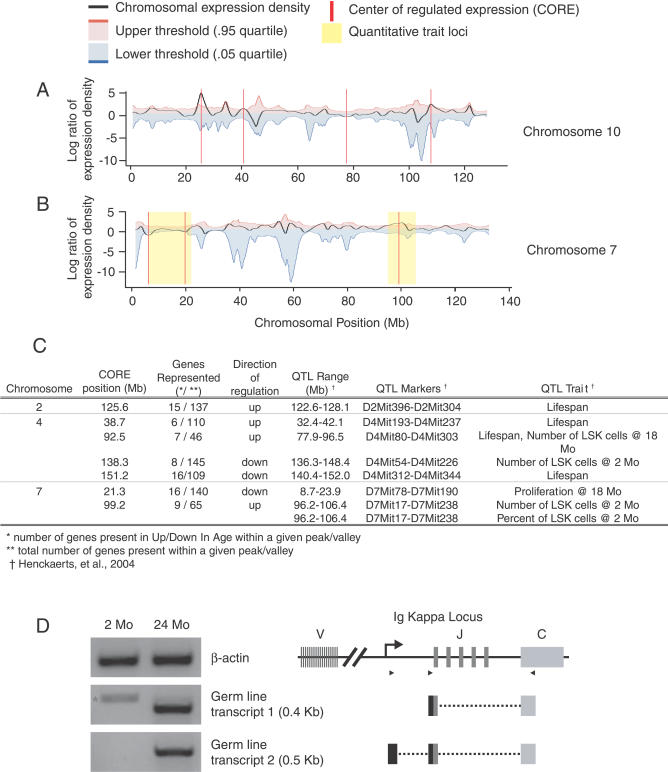
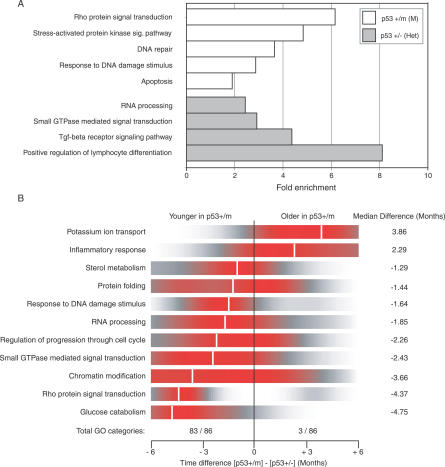
Age-related defects in stem cells can limit proper tissue maintenance and hence contribute to a shortened lifespan. Using highly purified hematopoietic stem cells from mice aged 2 to 21 mo, we demonstrate a deficit in function yet an increase in stem cell number with advancing age. Expression analysis of more than 14,000 genes identified 1,500 that were age-induced and 1,600 that were age-repressed. Genes associated with the stress response, inflammation, and protein aggregation dominated the up-regulated expression profile, while the down-regulated profile was marked by genes involved in the preservation of genomic integrity and chromatin remodeling. Many chromosomal regions showed coordinate loss of transcriptional regulation; an overall increase in transcriptional activity with age and inappropriate expression of genes normally regulated by epigenetic mechanisms was also observed. Hematopoietic stem cells from early-aging mice expressing a mutant p53 allele reveal that aging of stem cells can be uncoupled from aging at an organismal level. These studies show that hematopoietic stem cells are not protected from aging. Instead, loss of epigenetic regulation at the chromatin level may drive both functional attenuation of cells, as well as other manifestations of aging, including the increased propensity for neoplastic transformation.


Conflict of interest statement

Competing interests. The authors have declared that no competing interests exist.

Figures

Figure 1
Figure 1. Aging HSC Phenotypes and Functional Alterations
(A) Hoechst dye efflux by HSCs results in a SP (boxed) when viewed at two emission wavelengths. Comparison of the proportions of Sca-1–enriched SP cells from C57Bl/6 mice at 2 and 21 mo of age shows an approximate 9-fold increase with age. (B) Expression of the two canonical stem cell markers, c-Kit and Sca-1, does not change significantly between 2 and 21 mo of age within the lineage-negative (Lin) SP population, indicating the SP cells remain remarkably phenotypically pure and homogeneous. (C) Cell cycle analysis by propidium iodide staining of 2- and 23-mo-old HSCs purified on the basis of SParKLS. (D) Limiting dilution functional assay of HSCs. In competitive repopulation experiments, there was little difference in HSC activity 4 wk after transplantation in young versus old HSCs. However, at 8 and 16 wk post-transplantation, 21-mo-old HSCs showed a reduced contribution compared to 2-mo-old control HSCs, depending on the donor cell dose (a single asterisk [*] indicates p ≤ 0.03; double asterisks [**] indicate p ≤ 0.09). Error bars represent one standard error.
Figure 2
Figure 2. Gene Expression in HSC throughout Aging
The heat maps show expression levels for four different gene lists, with the degree of overlap among the lists indicated on the right. Color intensity indicates level of expression, where blue signifies low expression and red signifies high expression. Each column delineates the mean expression at 2, 6, 12, and 21 mo, and each row represents a given gene within each gene list. “Expressed in HSCs” refers to genes derived from a comparison of HSCs versus WBM.
Figure 3
Figure 3. Gene Ontology Analysis
(A) Fold enrichment over chance for selected GO categories of the Up-with-Age (red) and Down-with-Age (blue) gene lists. Bars without asterisks, p-value ≤ 0.05. Triple asterisks (***) indicate p ≤ 0.005. The number of genes found within each gene list and found on the entire array are shown for each GO category. (B) GO-timer T 1/2-max for selected GO categories as a function of density over time. Areas of color correspond to the time at which a GO category is undergoing the most rapid up-regulation (red) or down-regulation (blue). It is important to note that after a given GO category T 1/2-max, the expression remains up-regulated (red) or down-regulated (blue).
Figure 4
Figure 4. Up-Regulation of P-selectin Cell Surface Expression and NF-κB Localization in Aged HSCs.
(A) An increasing percentage of HSCs express P-selectin (SelP) when examined by FACS, ranging from 3% (2-mo-old HSCs) to 81% (28-mo-old HSCs). FITC, fluorescein isothiocyanate; PE, phycoerythrin. (B and C) HSCs stained with anti-p65 NF-kB antibody (red) and DAPI (blue). Two-month-old HSCs contain approximately 3% nuclear-localized p65; however, at 22 mo, approximately 71% show nuclear-localized p65.
Figure 5
Figure 5. Density Plots of Coordinately Regulated Gene Expression for Chromosomes 4, 7, 10, and 13.
(A) The black line represents the local density of coordinate regulation for all unique microarray probes. A positive value (peak) indicates a region where there are a greater number of up-regulated genes, whereas a negative value (valley) corresponds to a region of several down-regulated genes. The red vertical line indicates a CORE that extends beyond the threshold of significance (blue and red lines; p < 0.05) estimated by 1,000 randomized test sets. (B) Alignment of COREs on Chromosome 7 with previously published QTLs that represent chromosomal regions involved in age-related HSC function and organismal lifespan. Only those COREs that localize within established QTLs are shown. (C) Table showing the chromosomal alignment of COREs with known QTLs. QTLs are found on Chromosomes 2, 4, and 7 that contain COREs. (D) RT-PCR for IgK GL transcripts and diagram of transcript alignment with the GL IgK locus. The star (*) in the first lane, for GL transcript1, indicates a cDNA amplicon in young HSC that does not align with the IgK locus.
Figure 6
Figure 6. Gene Ontology for Pairwise Comparison and Age Differences between p53+/m and p53+/− HSC
(A) A pairwise comparison between the two genotypes reveals differences in p53-regulated pathways, including DNA repair, Response to DNA damage, Apoptosis, and others. The number of genes found within each gene list and on the entire array are shown for each GO category. (B) Using the best-fitting WT HSC aging data (R 2 < 0.50), age was extrapolated on a per-gene basis for both the p53+/m and p53+/− expression data. Genes were clustered by GO categories, and categories with significant age differences between the two p53 mutants were identified (Wilcoxon t-test; p-value < 0.05). Ninety-seven percent (84 of 87) of the GO categories were found to be younger (shifted left) in the p53+/m mice when compared to p53+/− mice. Shown is a density plot of the difference between the two genotypes on a per-gene basis for each GO category, where red indicates the highest density. Median differences in age for each GO category range from 1–5 mo and are demarcated by the white vertical line.

Comment in

References

    1. Van Zant G, Liang Y. The role of stem cells in aging. Exp Hematol. 2003;31:659–672. - PubMed
    1. Morrison SJ, Wandycz AM, Akashi K, Globerson A, Weissman IL. The aging of hematopoietic stem cells. Nat Med. 1996;2:1011–1016. - PubMed
    1. Sudo K, Ema H, Morita Y, Nakauchi H. Age-associated characteristics of murine hematopoietic stem cells. J Exp Med. 2000;192:1273–1280. - PMC - PubMed
    1. Rossi DJ, Bryder D, Zahn JM, Ahlenius H, Sonu R, et al. Cell intrinsic alterations underlie hematopoietic stem cell aging. Proc Natl Acad Sci U S A. 2005;102:9194–9199. - PMC - PubMed
    1. de Haan G, Van Zant G. Dynamic changes in mouse hematopoietic stem cell numbers during aging. Blood. 1999;93:3294–3301. - PubMed

Publication types

MeSH terms