

Review
doi: 10.1371/journal.pcbi.0030114.
Introduction to computational proteomics
Affiliations
- PMID: 17676979
- PMCID: PMC1933459
- DOI: 10.1371/journal.pcbi.0030114
Item in Clipboard
Review
Introduction to computational proteomics
PLoS Comput Biol.
2007 Jul.
No abstract available
Conflict of interest statement
Figures
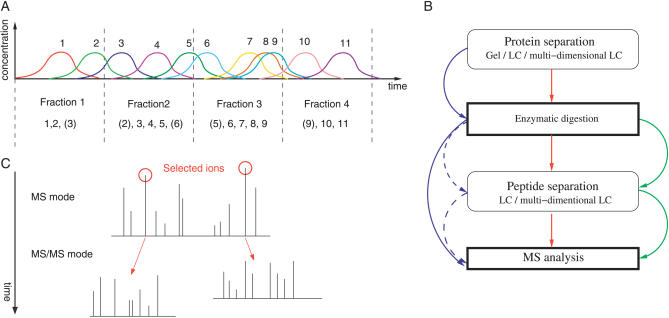
(A) Sample complexity reduction via an LC column. This is applicable to both proteins and peptides. It is possible to collect fractions at fixed or variable time intervals to obtain a series of less complex samples; however, direct MS analysis is also an option. The figure illustrates how peptides/proteins 1–11 are fractionated. (B) Major steps in “bottom-up” proteomics and combinations thereof. Optional steps and essential steps are in rounded and bold rectangles, respectively. Green represents shotgun peptide sequencing entire sample digestion followed by multidimensional LC separation of peptides. Blue represents the classical gel approach, with or without (dashed arrows) peptide LC. Red combines protein and peptide LC. (C) Data-dependent MS/MS analysis. Here, ESI of a liquid sample and alternation of the instrument between MS and MS/MS modes is illustrated. The data generated is a sequence of peptide experimental m/z associated with the corresponding fragments m/z. The complete analysis is named an LC-MS run.
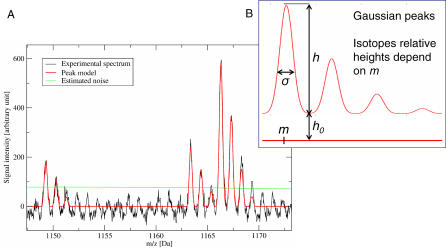
(A) Shown in this magnified region of a MALDI–PMF spectrum are the signals generated by peptides. The spectrum is acquired from a mixture of several peptides. Multiple copies of each peptide are present simultaneously. Multiple copies of a peptide (each detected with a small mass error) result in the essentially Gaussian shape of the peaks. Each copy comprises atoms containing different isotopes. Finally, one peptide yields several peaks with relative intensities that match the relative probabilities of the observed isotopes. The monoisotopic peak, i.e., the first peak, is relevant for mass computation. It is noteworthy to mention that the signal is noisy and the sampling limited. Shown in red is a model of a complete peptide signal fit to the experimental data. From the model location m, the mass can be directly deduced and detection of isotopes as additional peptide masses is avoided. The green line is an estimation of the local noise level. (B) Principle of the model.
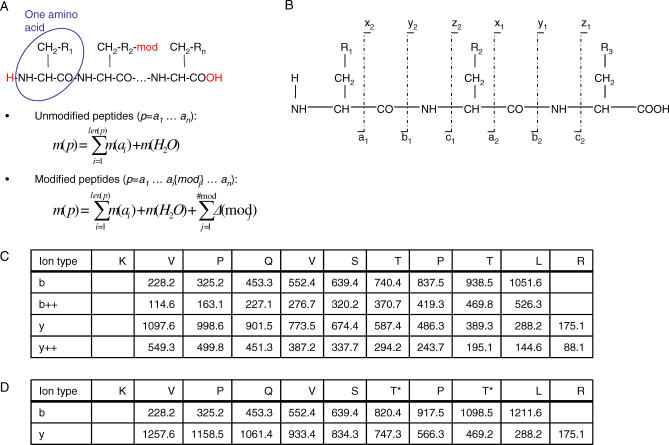
(A) As illustrated, the peptide atomic composition is dependent on the residue Ri and on fixed atoms (H2O). Therefore, once the peptide sequence is known, it is possible to sum the mass of each amino acid and add the mass of a water molecule to determine the theoretical mass of the peptide. If some amino acid residues are modified, mass shifts are added to the unmodified peptide mass. (B) Peptides fragment at specific locations named a,b,c,x,y,z. N-terminal fragments are termed ai,bi,ci, where i denotes the number of amino acids in the fragment. Similarly, the complementary C-terminal fragments are termed xn
−1,yn
−1,zn
−1, n is the peptide length. (C) Example of fragment mass computation. (D) The same example as in (C) with phosphorylated threonine residues (+79.9663 Da). Note that all fragment ions including the ion with one or two threonine residues are shifted in mass once or twice, respectively.
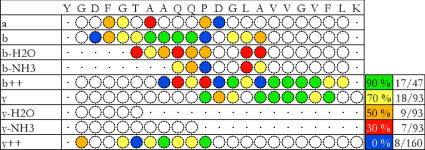
Match of an experimental spectrum with a peptide sequence. All theoretical fragment masses (within a given mass tolerance) observed in the experimental data are represented by a coloured disk. As is often the case, it is clear that not all fragment types are detected. Some neutral losses are not possible depending on the fragment amino acids (shown by a dot). Structural properties of the match are apparent, i.e., consecutive fragment ion matches (albeit with “holes”); and more intense b and y fragments (indicated by the colour, peak intensity relative order scale on the right with relative count of matched peaks).
In this simplified MS/MS search algorithm, we assume that the peptide charge states are unknown and that all possible values (1–4 typically) need to be assessed. In practice, charge state determination is dependent on instrument mass resolution. Additionally, it is common that the charge is known for some, but not all, peptides.
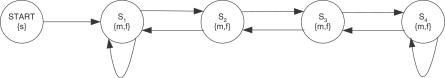
To detect sequences of consecutive fragment matches for a given type of fragment, it is possible to use a HMM. A sequence of symbols the length of the peptide is observed with alphabet letters {m,f}, m for match and f for failed match. The model topology is designed to accommodate for some missing matches: S1 represents a first uninformed match, whereas S2 and S3 represent matches with preceding matches.
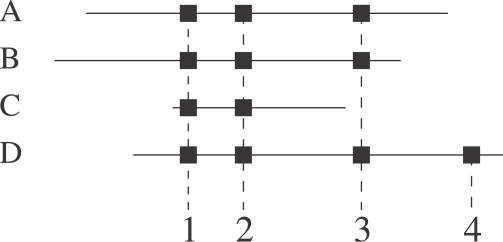
Complications in identifying proteins. Four proteins (A, B, C, D) are identified by four distinct peptides (black squares). Although A and B are different, it is impossible to ascertain which molecule is present, as both have been identified by the same (shared) peptides. A variation of this is shown in C. Protein D shares three peptides with A and B, and two with C, but also has a specific fourth peptide. From this information it can be concluded that D is in the sample.
Spectrum graph of peptide MTDSK. The spectrum contains the b and y fragment ion masses plus two neutral losses and two peaks generated from noise. Only one amino acid's mass differences are accepted. Masses are complemented and interpreted as b fragments. Even in this oversimplified case, it is observed that many edges are created in addition to those that are necessary. In particular, part of the reverse sequence in the graph is observed. The graph complexity increases rapidly with real spectra and with two amino acid mass differences accepted; see also the two examples given in Figures S1 and S2.
Similar articles
-
Key challenges in proteomics and proteoinformatics. Progress in proteins.IEEE Eng Med Biol Mag. 2005 May-Jun;24(3):34-40. doi: 10.1109/memb.2005.1436456. IEEE Eng Med Biol Mag. 2005. PMID: 15971839 Review. No abstract available.
-
Phosphoproteomics by mass spectrometry and classical protein chemistry approaches.Mass Spectrom Rev. 2005 Nov-Dec;24(6):828-46. doi: 10.1002/mas.20042. Mass Spectrom Rev. 2005. PMID: 15538747 Review.
-
Computational prediction of proteotypic peptides for quantitative proteomics.Nat Biotechnol. 2007 Jan;25(1):125-31. doi: 10.1038/nbt1275. Epub 2006 Dec 31. Nat Biotechnol. 2007. PMID: 17195840
-
Latest developments in sample treatment for 18O-isotopic labeling for proteomics mass spectrometry-based approaches: a critical review.Talanta. 2010 Feb 15;80(4):1476-86. doi: 10.1016/j.talanta.2009.04.053. Epub 2009 May 4. Talanta. 2010. PMID: 20082805
-
Proteomics in 2005/2006: developments, applications and challenges.Anal Chem. 2007 Jun 15;79(12):4325-43. doi: 10.1021/ac070741j. Epub 2007 May 4. Anal Chem. 2007. PMID: 17477510 Review. No abstract available.
Cited by
-
Dispec: a novel peptide scoring algorithm based on peptide matching discriminability.PLoS One. 2013 May 13;8(5):e62724. doi: 10.1371/journal.pone.0062724. Print 2013. PLoS One. 2013. PMID: 23675420 Free PMC article.
-
Simulation Testbed for Evaluating Distributed Querying and Searching of Mass Spectrometry Big Data in a Network-based Infrastructure.Proc (IEEE Int Conf Big Data Comput Serv Appl). 2021 Aug;2021:137-142. doi: 10.1109/bigdataservice52369.2021.00022. Epub 2021 Oct 18. Proc (IEEE Int Conf Big Data Comput Serv Appl). 2021. PMID: 35425943 Free PMC article.
-
Pathway and network analysis in proteomics.J Theor Biol. 2014 Dec 7;362:44-52. doi: 10.1016/j.jtbi.2014.05.031. Epub 2014 Jun 6. J Theor Biol. 2014. PMID: 24911777 Free PMC article. Review.
-
Exploring COVID-19 pathogenesis on command-line: A bioinformatics pipeline for handling and integrating omics data.Adv Protein Chem Struct Biol. 2022;131:311-339. doi: 10.1016/bs.apcsb.2022.04.002. Epub 2022 May 12. Adv Protein Chem Struct Biol. 2022. PMID: 35871895 Free PMC article.
-
A tutorial for software development in quantitative proteomics using PSI standard formats.Biochim Biophys Acta. 2014 Jan;1844(1 Pt A):88-97. doi: 10.1016/j.bbapap.2013.04.004. Epub 2013 Apr 12. Biochim Biophys Acta. 2014. PMID: 23584085 Free PMC article. Review.
References
-
- Aebersold R, Mann M. Mass spectrometry-based proteomics. Nature. 2003;422:198–207. - PubMed
-
- Pandey A, Mann M. Proteomics to study genes and genomes. Nature. 2000;405:837–846. - PubMed
-
- Patton WF. Proteome analysis. II. Protein subcellular redistribution: Linking physiology to genomics via the proteome and separation technologies involved. J Chromatogr B Analyt Technol Biomed Life Sci. 1999;722:203–223. - PubMed
-
- Khatib-Shahidi S, Andersson M, Herman JL, Gillespie TA, Caprioli RM. Direct molecular analysis of whole-body animal tissue sections by imaging MALDI mass spectrometry. Anal Chem. 2006;78:6448–6456. - PubMed
-
- Gavin AC, Aloy P, Grandi P, Krause R, Boesche M, et al. Proteome survey reveals modularity of the yeast cell machinery. Nature. 2006;440:631–636. - PubMed
Publication types
MeSH terms
Substances
LinkOut - more resources
Full Text Sources
