. 2007 Apr;246(2):92-102.
doi: 10.1016/j.cellimm.2007.06.005. Epub 2007 Aug 2.

Vaccinia virus infection induces dendritic cell maturation but inhibits antigen presentation by MHC class II

Affiliations

Vaccinia virus infection induces dendritic cell maturation but inhibits antigen presentation by MHC class II

Yongxue Yao et al. Cell Immunol. 2007 Apr.

Abstract

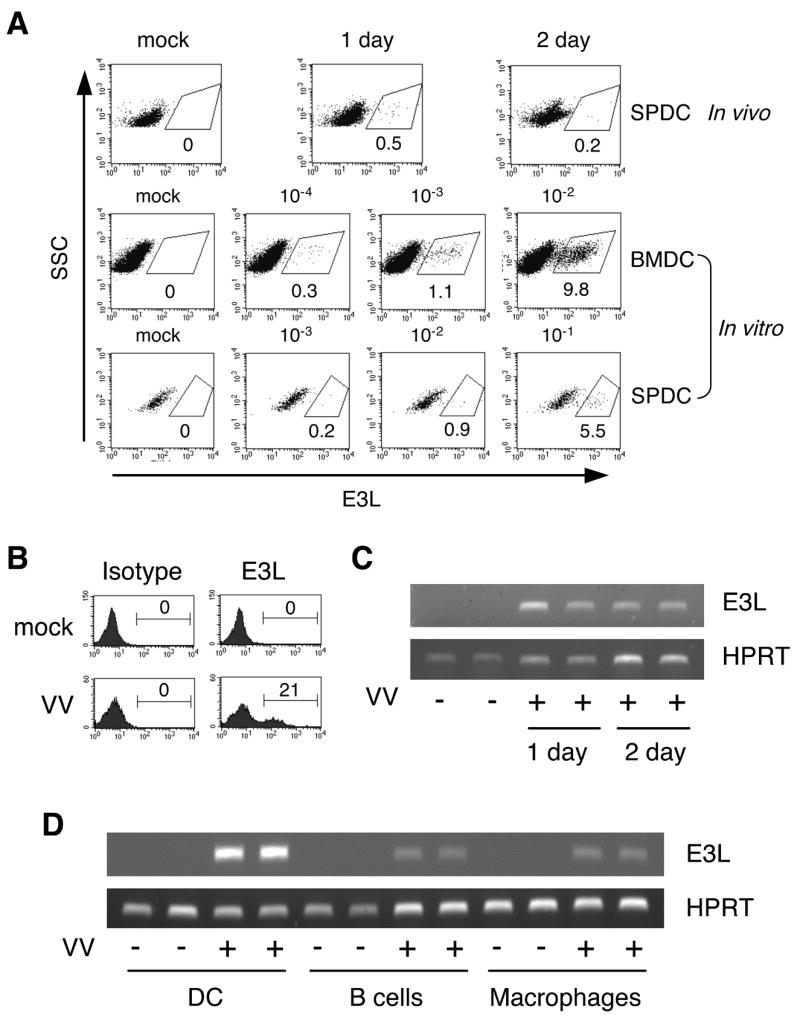
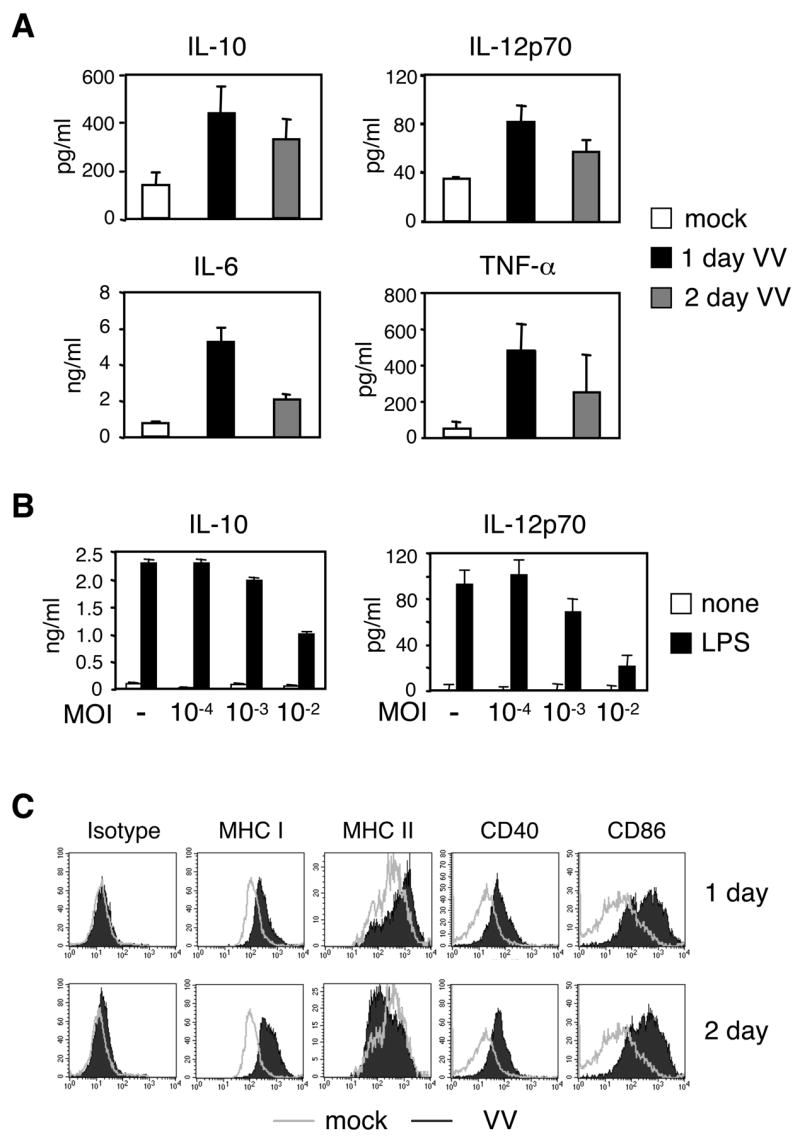
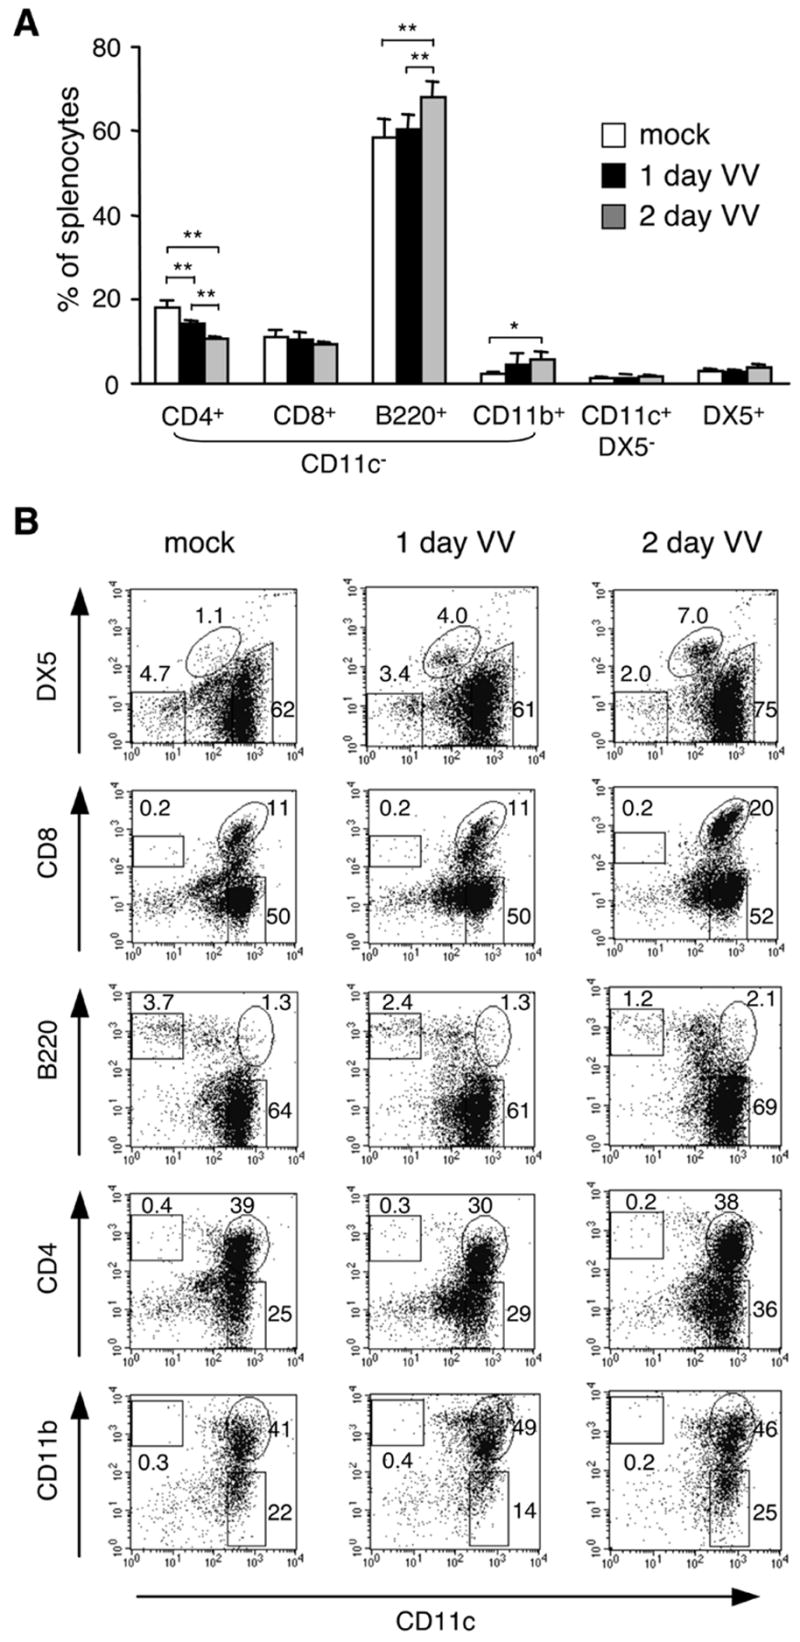
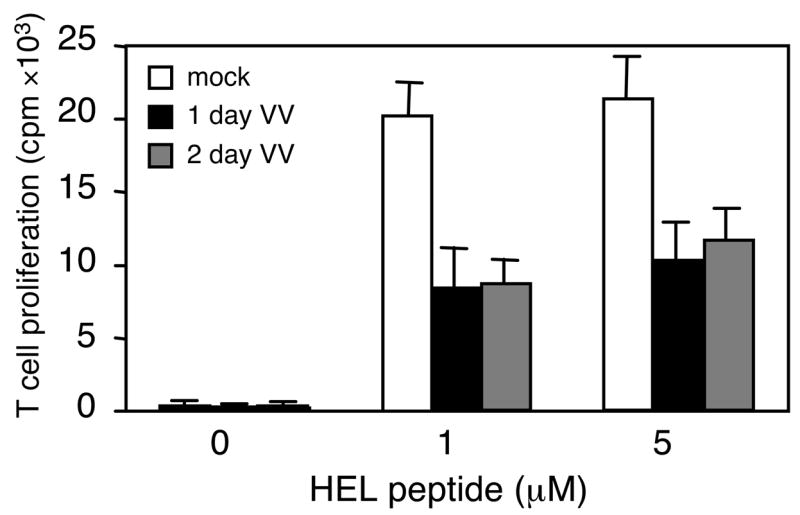
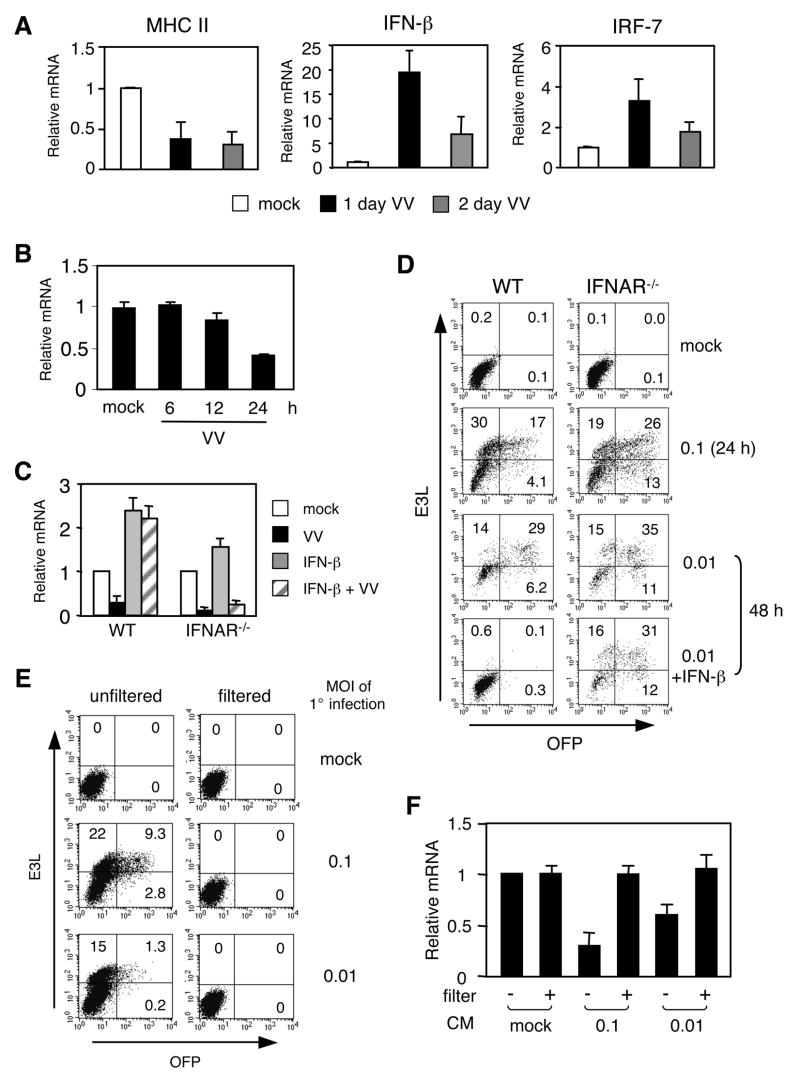
Vaccinia virus (VV) infection is known to inhibit dendritic cells (DC) functions in vitro. Paradoxically, VV is also highly immunogenic and thus has been used as a vaccine. In the present study, we investigated the effects of an in vivo VV infection on DC function by focusing on early innate immunity. Our data indicated that DC are activated upon in vivo VV infection of mice. Splenic DC from VV-infected mice expressed elevated levels of MHC class I and co-stimulatory molecules on their cell surface and exhibited the enhanced potential to produce cytokines upon LPS stimulation. DC from VV-infected mice also expressed a high level of interferon-beta. However, a VV infection resulted in the down-regulation of MHC class II expression and the impairment of antigen presentation to CD4 T cells by DC. Thus, during the early stage of a VV infection, although DC are impaired in some of the critical antigen presentation functions, they can promote innate immune defenses against viral infection.


Conflict of interest statement

The authors have no conflicting financial interests.

Figures

Figure 1
Figure 1. Detection of VV infection
A, In vivo infection was carried out using C57BL/6 mice (four mice/group) that were injected with HBSS/BSA (mock) or 1×10⁶ pfu VV via i.p as described in the Materials and Methods. Mice were sacrificed at the indicated time. Total splenocytes were stained with TW2.3 Ab recognizing E3L. For in vitro infection, BMDC and total splenocytes were infected and cultured for 24 hrs with MOI as indicated. CD11c+ cells were gated and shown. The percentage indicates % positive cells among CD11c+ cells. B, Specificity of TW2.3 staining. BMDC were infected 24 hrs with VV at a MOI of 0.1 and stained with TW2.3 or its isotype-matched control Ab. The numbers indicate % positive cells. C, RNA was prepared from CD11c+ enriched splenic DC from mock- or VV-infected mice as in (A) and analyzed for E3L expression. D, CD11c+ DC cells were prepared as in (C), and B220+ B cells and CD11b+ macrophages were enriched from CD11c splenocytes of one day infected mice. RT-PCR was performed to detect E3L gene expression. Data are representative of at least 2 independent experiments.
Figure 2
Figure 2. Activated phenotype of SPDC except MHC class II expression
A, SPDC were prepared as in Figure 1 and stimulated with LPS (1 μg/ml) overnight. ELISA was performed to measure the levels of IL-10, IL-12p70, IL-6, and TNF-α. B, BMDC were infected in vitro with VV at the indicated MOI for 24 h followed by LPS stimulation overnight. IL-10 and IL-12p70 production was measured by ELISA. C, SPDC from mock- or VV-infected mice were used to determine cell surface expression levels of MHC and co-stimulatory molecules. DX5CD11c+ or CD11chigh cells were gated as in Figure 3B and shown. Open and filled histograms are DC from mock- and VV-infected mice, respectively. Data are the mean ± SD (A and B) or representative (C) of at least 2 independent experiments.
Figure 3
Figure 3. Changes in cell composition and DC subset in the spleen from VV-infected mice
A, Total splenocytes from mock- or VV-infected mice were stained for cell surface markers and analyzed for different cell types. *p < 0.01, **p < 0.001. B, CD11c+ enriched splenocytes were analyzed for purity and DC subpopulations. Numbers indicate each subpopulation as a percentage of live cells. Note that DX5+ cells are CD11clow. Data are the mean ± SD (A) or representative (B) of at least 2 independent experiments.
Figure 4
Figure 4. Impaired APC function of SPDC from VV-infected mice
CD11c+ enriched splenic DC from mock- or VV-infected mice were incubated with increasing amounts of the HEL74–88 peptide for 16 h, followed by washing, fixation and cultivation with Ag-specific T cells for 24 h. T cell activation was assessed by measuring IL-2 production using HT-2 cell proliferation. Data are expressed as cpm and are representative of 3 independent experiments with the SD for triplicated samples indicated.
Figure 5
Figure 5. Role of type I IFN in MHC class II expression and viral replication in DC
A, SPDC were enriched from mock- or VV-infected mice to prepare RNA. qRT-PCR was performed to assess MHC class II, IFN-β, and IRF-7 mRNA. The relative mRNA levels were normalized to GAPDH gene expression. B, MHC class II mRNA levels in SPDC enriched from mock- or VV-infected mice at indicated time points were measured by qRT-PCR as in (A). C. BMDC from WT or IFNAR−/− mice were infected with the mKO mutant VV (MOI of 0.01) for 90 min and cultured with or without IFN-β for 48 h. MHC class II mRNA levels were measured by qRT-PCR. D, BMDC were prepared, infected (MOI of 0.1 for 24 hrs and 0.01 for 48 hrs), and cultured as in (C) for 24 or 48 hrs. E3L and OFP expression were analyzed by flow cytometry. Numbers indicate each subpopulation as a percentage of live cells. E and F, BMDC from WT mice were infected with the mKO mutant VV (MOI of 0.1 and 0.01) for 24 hrs (indicated as 1° infection). Conditioned medium (CM) from infected BMDC were collected, filtered or unfiltered, and then added to uninfected BMDC. Cells were analyzed an additional 24 h post-infection. Efficiency of virus depletion was monitored by flow cytometry (E). MHC class II mRNA levels were measured by qRT-PCR (F). Data are the mean ± SD (A, B, C and F) or representative (D and E) of at least 2 independent experiments.

References

    1. Moss B. Genetically engineered poxviruses for recombinant gene expression, vaccination, and safety. Proc Natl Acad Sci U S A. 1996;93:11341–8. - PMC - PubMed
    1. Wollenberg A, Engler R. Smallpox, vaccination and adverse reactions to smallpox vaccine. Curr Opin Allergy Clin Immunol. 2004;4:271–5. - PubMed
    1. Rosenthal SR, Merchlinsky M, Kleppinger C, Goldenthal KL. Developing new smallpox vaccines. Emerg Infect Dis. 2001;7:920–6. - PMC - PubMed
    1. Smith GL, Symons JA, Khanna A, Vanderplasschen A, Alcami A. Vaccinia virus immune evasion. Immunol Rev. 1997;159:137–54. - PubMed
    1. McFadden G. Smallpox: an ancient disease enters the modern era of virogenomics. Proc Natl Acad Sci U S A. 2004;101:14994–5. - PMC - PubMed

Publication types

Substances