. 2007 Aug 2;55(3):393-405.
doi: 10.1016/j.neuron.2007.07.007.

Wnt/Axin1/beta-catenin signaling regulates asymmetric nodal activation, elaboration, and concordance of CNS asymmetries

Affiliations

Wnt/Axin1/beta-catenin signaling regulates asymmetric nodal activation, elaboration, and concordance of CNS asymmetries

Matthias Carl et al. Neuron. .

Abstract

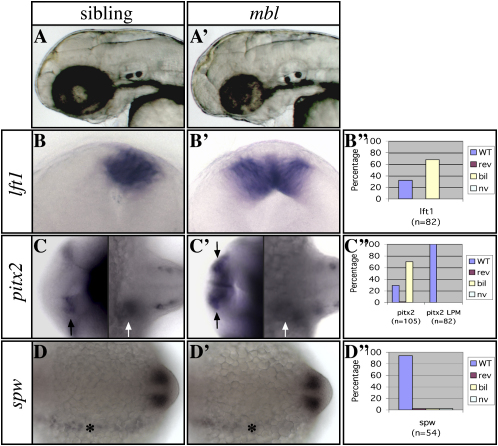
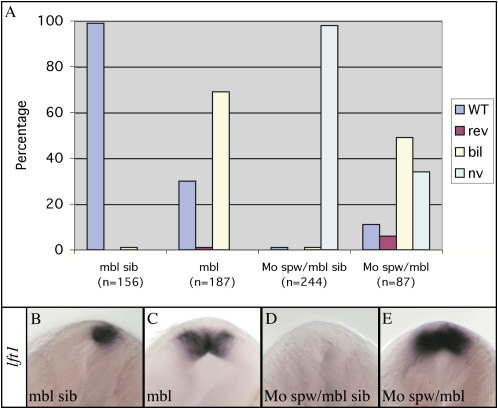
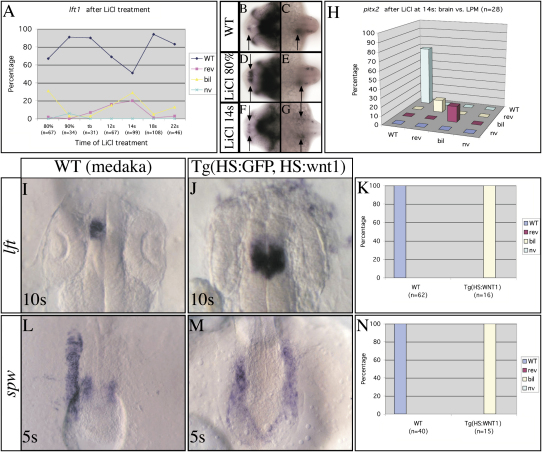
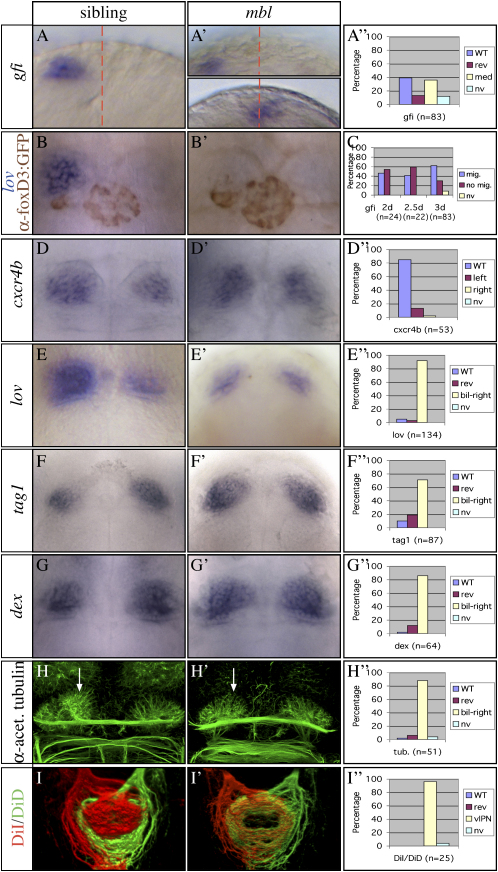
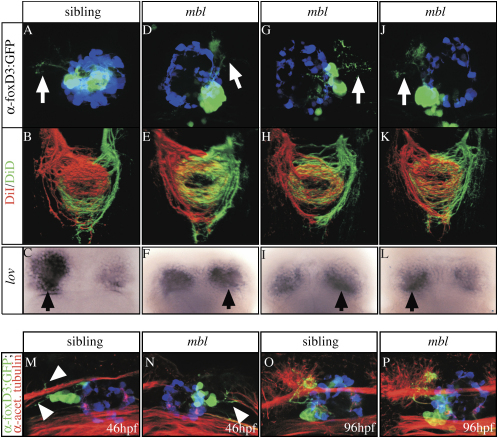
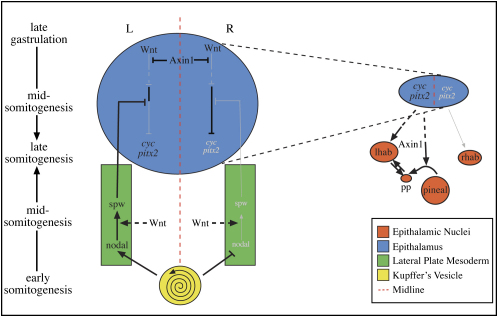
Nodal activity in the left lateral plate mesoderm (LPM) is required to activate left-sided Nodal signaling in the epithalamic region of the zebrafish forebrain. Epithalamic Nodal signaling subsequently determines the laterality of neuroanatomical asymmetries. We show that overactivation of Wnt/Axin1/beta-catenin signaling during late gastrulation leads to bilateral epithalamic expression of Nodal pathway genes independently of LPM Nodal signaling. This is consistent with a model whereby epithalamic Nodal signaling is normally bilaterally repressed, with Nodal signaling from the LPM unilaterally alleviating repression. We suggest that Wnt signaling regulates the establishment of the bilateral repression. We identify a second role for the Wnt pathway in the left/right regulation of LPM Nodal pathway gene expression, and finally, we show that at later stages Axin1 is required for the elaboration of concordant neuroanatomical asymmetries.


Figures

Figure 1
Figure 1
The mbl Mutation in axin1 Causes Brain-Specific Loss of Asymmetric Nodal Pathway Gene Expression (A and A′) Lateral views of the head with anterior to the left of 2-day-old living wild-type (left) and mbl mutant (right) embryos. (B and B′) Frontal views of the epithalamus (dorsal to the top) of 24s stage wild-type and mbl embryos. (C and C′) Dorsal views of the brain (left) and trunk LPM (right) of 24s stage wild-type and mbl embryos with anterior to the left. (D and D′) Dorsal views of the trunk LPM of 14s stage wild-type and mbl embryos with anterior to the left. The markers used to assess asymmetries are indicated to the left of the panels. (B″–D″) Graphs illustrate the percentage of mbl embryos with wild-type (WT) left, reversed (rev) right, bilateral (bil), or not visible (nv) Nodal pathway gene expression (see also Table S1). Note the loss of asymmetry in Nodal pathway gene expression in the epithalamus ([B], [B′], and black arrows in [C] and [C′]), but not the lateral plate mesoderm (LPM; white arrows in [C] and [C′] and asterisks in [D] and [D′]) in mutants. The expression analysis of lft1 and pitx2 in all figures refers to expression in the brain, unless indicated otherwise.
Figure 2
Figure 2
The mbl Mutation Can Activate Epithalamic Nodal Pathway Genes Epistatic to Loss of Spw Activity (A) The graph illustrates the percentage of embryos with wild-type (WT) left, reversed (rev) right, bilateral (bil), or not visible (nv) Nodal pathway gene expression in the epithalamus of wild-type (mbl sib) mbl (mbltm213/tm213), spw morphant (MoSpw/mbl sib), and mbl;spw morphant (MoSpw/mbl) embryos. The knockdown of Spw function results in the absence of lft1 and pitx2 expression only in the presence of wild-type Axin1. (B–E) Frontal views of the epithalamus (dorsal to the top) of 24s stage wild-type (mbl sib) mbl, spw morphant (MoSpw/mbl sib), and mbl;spw morphant (MoSpw/mbl) embryos analyzed for lft1 expression.
Figure 3
Figure 3
Manipulating Wnt Signaling during Mid-Somite Stages Disrupts the Laterality of Nodal Pathway Expression in Both LPM and Brain (A, H, K, and N) Graphs illustrate the percentage of embryos with wild-type (WT) left, reversed (rev) right, bilateral (bil), or not visible (nv) Nodal pathway gene expression (see also Tables S2 and S3). (A) Zebrafish embryos were treated with lithium chloride (LiCl) at the stages indicated and analyzed for Nodal pathway gene expression in the brain (and LPM in [H]) at 24s stage (see also Experimental Procedures). (B–G) Dorsal views of the (B, D, and F) brain and (C, E, and G) trunk LPM of 24s stage wild-type and mbl embryos, with anterior to the left analyzed for pitx2 expression. The arrows indicate the sites of pitx2 expression (epithalamus in [B], [D], and [F]; LPM in [C], [E], and [G]). (B–E) LiCl treatment of embryos at 80% epiboly results in the loss of pitx2 asymmetry in the brain alone, whereas (F–H) treatments at 14 somite stage result in disruption of expression concordantly in brain and LPM. (I, J, L, and M) Dorsal views of medaka embryos (anterior to the top, stages are indicated at the bottom left of each panel) showing (I and J) lft expression in the epithalamus and (L and M) spw expression in the LPM. Heat shock treatments were performed at 4s stage (I and J) and at 2s stage (L and M). Heat shock activation of (J and M) wnt1 in Tg(HS:GFP, HS:wnt1) transgenic medaka embryos causes bilateral Nodal pathway gene expression in the CNS and LPM (K and N). (K and N) Heat shock of wild-type embryos had no effect on lft or spw expression.
Figure 4
Figure 4
mbl Mutants Have Parapineal Migration Defects and Bilaterally Symmetric Habenulae (A–H and A′–H′) Dorsal or frontal views of the epithalamus (anterior to the top) of (A, A′, D, and D′) 2-day-, (B and B′) 2.5-day-, (F and F′) 3-day-, and (E, E′, G, G′, H, and H′) 4-day-old wild-type and mbl mutant embryos. All markers used in the panels are indicated on the left (the text color matches the expression domain color in double labelings). (A–A″ and C) gfi is expressed exclusively in the parapineal (midline is indicated by the red dotted line). Of the two mbl embryos shown, one shows normally migrated parapineal cells, and the other shows parapineal cells at the midline. (B and B′) Embryos carried a foxD3:GFP transgene [mbltm213 × Tg(foxD3:GFP)]. Double labeling shows that, even in the presence of migrating parapineal cells, lov gene expression remains low in the left habenula of the mutant (B′). (H and H′) The arrows mark the neuropil of the medial left habenula, which is reduced in the mbl mutant. (I and I′) Dorsal views of 3D reconstructions of confocal images of habenular axon terminals in the target IPN nucleus labeled with lipophilic dyes as indicated. (A″ and D″–H″) Graphs illustrate the percentage of embryos with wild-type (WT) left, reversed (rev) right, medial (med), bilateral (bil), or not visible (nv) gene expression or neuropil formation. Bilateral right (bil-right) indicates that both habenulae exhibit the profile of gene expression or neuropil formation characteristic for the right habenula of wild-type embryos. The graph in (I″) shows that in nearly all mbl embryos the axonal projections coming from the habenulae intermingle in the ventral IPN.
Figure 5
Figure 5
Epithalamic Asymmetries Are Largely Uncoupled in mbl Embryos (A–P) Dorsal views of (A–L) 4-day-old embryos derived from a mbltm213 × Tg(foxD3:GFP);Tg(lft1:GFP) incross were analyzed for (A, D, G, and J) parapineal migration and projections. The labeling performed and the genotype of the embryos analyzed are indicated on the left and at the top, respectively. (A, D, G, J, M, and N) White arrows mark parapineal projections toward the left or right habenula; pineal cells are pseudocolored in blue. (B, E, H, and K) Axonal projections into the IPN and (C, F, I, and L) lov gene expression (overdeveloped, black arrows mark the side of slightly more intense lov gene expression). The habenulae of all mbl embryos exhibit the projection pattern characteristic for the right habenula, irrrespective of parapineal projections. (M–P) The onset ([M and N]; arrowheads) and targeting (O and P) of parapineal projections is superficially normal in the mbl embryos, irrespective of the migration of parapineal cells. The pineal cells are pseudocolored blue.
Figure 6
Figure 6
A Model for the Establishment and Elaboration of CNS Asymmetry On the left side of the schematic, events in the epiphysial region of the forebrain from late gastrula to 20 somite stage are indicated in the large blue oval. Events in the LPM are shown in the green boxes. Black lines and lettering indicate that the gene/pathway is active, while gray lines and lettering indicate repression/lack of activation. In the late gastrula neural plate, Axin1 bilaterally represses Wnt signaling in the epithalamus, allowing the establishment of bilateral repression of epithalamic Nodal expression that is carried through to late somite stages. This repression is overcome on the left side by Spw activity from the LPM. In the LPM, the Nodal pathway is activated by Nodal signals emanating from around KV (or the node—see Nakamura et al. [2006]), and activation is subsequently propagated through the left LPM and is shut down on the right. Manipulations to Wnt signaling at this stage (after regression of KV) can disrupt the propagation of Nodal expression. Not shown is the ability of Nodal signals on one side of the LPM to block activation of the pathway on the other side (Ohi and Wright, 2007). Although Spw normally only relieves repression in the left epithalamus, the bilateral symmetry of repression in the epithalamus means that any manipulations or mutations that result in right-sided Spw activity will concordantly lead to right-sided epithalamic activation of Nodal signaling. On the right side of the schematic, events downstream of left-sided activation of Nodal signaling are shown. Nodal signaling influences the laterality of parapineal and habenular asymmetries, but not their establishment per se. How Nodal does this is unknown, and it is not clear whether the pathway exerts its effects primarily through actions on the parapineal, the left habenula, or both (dashed arrows). Axin1 is required for the elaboration of asymmetries downstream of Nodal signaling, both for timely migration of parapineal cells (pp) and for the communication between habenula and parapineal that ensure concordant elaboration of neuroanatomical asymmetries. The spiral symbolises the ciliary flow in KV; lhab, left habenula; rhab, right habenula; L, left; R, right.

References

    1. Aghaallaei N., Bajoghli B., Walter I., Czerny T. Duplicated members of the Groucho/Tle gene family in fish. Dev. Dyn. 2005;234:143–150. - PubMed
    1. Aizawa H., Bianco I.H., Hamaoka T., Miyashita T., Uemura O., Concha M.L., Russell C., Wilson S.W., Okamoto H. Laterotopic representation of left-right information onto the dorso-ventral axis of a zebrafish midbrain target nucleus. Curr. Biol. 2005;15:238–243. - PMC - PubMed
    1. Aizawa H., Goto M., Sato T., Okamoto H. Temporally regulated asymmetric neurogenesis causes left-right difference in the zebrafish habenular structures. Dev. Cell. 2007;12:87–98. - PubMed
    1. Amack J.D., Yost H.J. The T box transcription factor no tail in ciliated cells controls zebrafish left-right asymmetry. Curr. Biol. 2004;14:685–690. - PubMed
    1. Bajoghli B., Aghaallaei N., Soroldoni D., Czerny T. The roles of Groucho/Tle in left-right asymmetry and Kupffer's vesicle organogenesis. Dev. Biol. 2007;303:347–361. - PubMed

Publication types

MeSH terms