. 2007 Aug 2;55(3):417-33.
doi: 10.1016/j.neuron.2007.06.036.

Dlx1 and Dlx2 control neuronal versus oligodendroglial cell fate acquisition in the developing forebrain

Affiliations

Dlx1 and Dlx2 control neuronal versus oligodendroglial cell fate acquisition in the developing forebrain

Magdalena A Petryniak et al. Neuron. .

Abstract

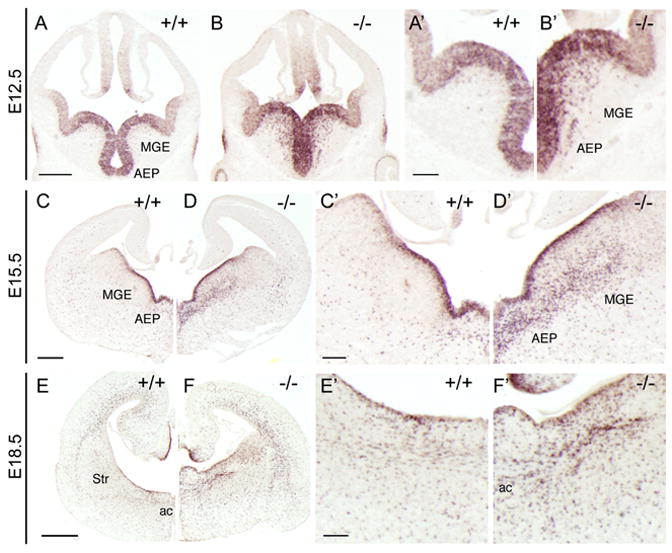
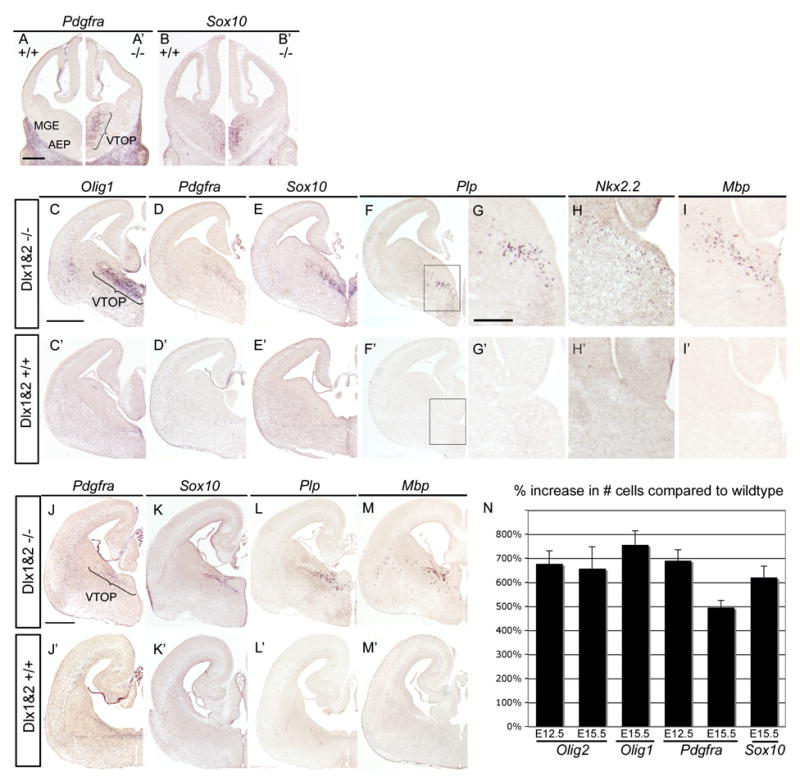
Progenitors within the ventral telencephalon can generate GABAergic neurons and oligodendrocytes, but regulation of the neuron-glial switch is poorly understood. We investigated the combinatorial expression and function of Dlx1&2, Olig2, and Mash1 transcription factors in the ventral telencephalon. We show that Dlx homeobox transcription factors, required for GABAergic interneuron production, repress oligodendrocyte precursor cell (OPC) formation by acting on a common progenitor to determine neuronal versus oligodendroglial cell fate acquisition. We demonstrate that Dlx1&2 negatively regulate Olig2-dependant OPC formation and that Mash1 promotes OPC formation by restricting the number of Dlx+ progenitors. Progenitors transplanted from Dlx1&2 mutant ventral telencephalon into newborn wild-type mice do not produce neurons but differentiate into myelinating oligodendrocytes that survive into adulthood. Our results identify another role for Dlx genes as modulators of neuron versus oligodendrocyte development in the ventral embryonic forebrain.


Figures

Figure 1
Figure 1. Molecular characterization of medial ganglionic eminence progenitors
(A–B) E12.5 coronal section through mouse forebrain showing DLX2 (red), OLIG2 (green) and MASH1 (blue) as visualized by indirect immunofluorescence at the level of the MGE and LGE. (A′–B′) Higher magnification view of the ventromedial MGE, boxed region in (A–B), with the VZ, SVZ1 and SVZ2 labeled. (C) Graphical illustration of the percent contribution of DLX2, OLIG2, and MASH1 expressing cells in the VZ, SVZ1 and SVZ2 determined from (A′) and (B′). Four main colors in the graph represent population of cells that express either OLIG2 (green), DLX2 (red), OLIG2 and DLX2 (yellow) and MASH1 (blue). Shaded portion of the colored bars represent subpopulations within the groups that co-express MASH1. (A′, C) OLIG2 expression is high in the MGE, where nearly all VZ cells are OLIG2+, and lower in the LGE. DLX2 expression is high in both the LGE and MGE. DLX2 is expressed in ~50% of cells in VZ of the MGE, where it is largely co-expressed with OLIG2. DLX2 expression increases to ~90% of cells in the SVZ, while OLIG2 expression progressively decreases to ~50% in SVZ1 and ~20% in SVZ2. OLIG2+/DLX2+ population declines to less than 10% of cells in the SVZ2. Thus, there is a reciprocal relationship between OLIG2 and DLX2 expression as cells migrate from the VZ to SVZ2, and begin to differentiate. (B′–C) Most MASH1+ cells express DLX2 in the VZ and SVZ of the ventromedial MGE. Note the two main populations of cells in the VZ: OLIG2+/DLX2+/MASH1+ and OLIG2-only. These populations combined decrease to less than 20% of cells in the SVZ2, as the proportion of DLX2+ cells increases. Also, proportion of DLX2+ cells expressing MASH1 declines to ~60% in the SVZ1 and ~35% in the SVZ2.
Figure 2
Figure 2. DLX2 and OLIG2 are co-expressed in VZ/SVZ cells but not in cells within the cortex or fiber tracts
(A–C) DLX2 (red) and OLIG2 (green) expressing cells visualized in coronal sections through mouse forebrain at E15.5 (A) and E18.5 (B–C) using indirect immunofluorescence. DAPI (blue) labels cell nuclei. Boxed areas in (A–C) are shown at higher magnification in (A′, B′–B‴, C′). DLX2 and OLIG2 are co-expressed in progenitors within the VZ/SVZ (A′, B′, C′), but not in more mature cells within the cortex (Ctx) (B″), corpus callosum (cc) (B‴) or anterior commissure (ac) (C′). (D–E) OPCs within the anterior commissure (ac) at E15.5 visualized by indirect immunofluorescence for PDGFRα (green). All PDGFRα+ cells co-express OLIG2 (D, red), but not DLX2 (E, red). (D′–E′) are higher magnification views of (D–E). Closed arrows point to examples of PDGFRα +/OLIG2+ cells, and open arrows point to examples of PDGFRα cells that do not co-localize with DLX2. Str, striatum; Spt, septum; MGE/LGE, medial/lateral ganglionic eminence. Scale bars A–C = 200μm Scale bar A′–B′, D–E = 50μm Scale bar B″–B‴, C′–E′, D′–E′ = 30μm
Figure 3
Figure 3. Olig2 expression is increased in Dlx1&2 mutants
(A–F) In situ hybridization for Olig2 on coronal sections of E12.5 (A–B), E15.5 (C–D), and (E–F) E18.5 wildtype (+/+) and Dlx1&2 mutant (−/−). A′–F′ are higher magnification views of A–F. Olig2 expression is expanded within the MGE and AEP of Dlx1&2 mutants at E12.5 and E15.5, and in the ventral telencephalon at the level of the anterior commissure (ac) at E18.5. AEP, anterior entopeduncular region; MGE, medial ganglionic eminence; Str, striatum. Scale bar A–D = 250μm Scale bar E–F = 500μm Scale bar A′–F′ = 100μm
Figure 4
Figure 4. The number of OPCs is increased in Dlx1&2 mutants
Coronal sections of E12.5 (A–B, A–B′), E15.5 (C–I, C′–I′), and E18.5 (J–M, J′–M′) Dlx1&2 mutant (−/−) and wildtype (+/+) labeled by in situ hybridization for OPC markers. The number of cells expressing Pdgfra and Sox10 is increased in the medial-ventral MGE and AEP of Dlx1&2 mutants as compared to wildtype at all ages. This region is defined as the ventral telencephalic precursor (VTOP) domain. At E15.5, the number of cells expressing Olig1 (C–C′), Plp (F–F′), Nkx2.2 (H, H′), and Mbp (I, I′) is also increased in Dlx1&2 mutants compared to wildtype. The boxed region in (F–F′) is shown at higher magnification in (G–G′). The increase in OPC markers persists at E18.5 (J–M, J′–M′). (N) Quantification of OPC marker increase in the VTOP region at E12.5 and E15.5. 20μm sections that contained the VTOP region were analyzed from wildtype and Dlx1&2 mutant pairs (n=3). The graph depicts the average percentage increase (+ SEM) in the number of cells labeled with the corresponding OPC marker in the Dlx1&2 mutant compared to wildtype. Plp, Nkx2.2, and Mbp are increased in Dlx1&2 mutants, but are not included in this graph because few or no labeled cells were detected in wildtype animals. AEP, anterior entopeduncular area; MGE, medial ganglionic eminence. Scale bar A–B, A′–B′ = 250μm Scale bar C–F, C′–F′ = 500μm Scale bar G–I, G′–I′ = 200μm Scale bar J–M, J′–M′ = 500μm
Figure 5
Figure 5. Precursor proliferation within the MGE/AEP is not increased in Dlx1&2 mutants; DLX1&2 regulate OLIG2 expression
(A–F) Proliferation is not increased in the MGE/AEP of Dlx1&2 mutants. Coronal sections showing the MGE/AEP area from E12.5 (A–B) and E15.5 (D–E) wildtype (+/+) and Dlx1&2 mutant (−/−) mice were double-labeled for PH3 (red) and OLIG2 (green). VZ, the primary proliferative zone; SVZ, secondary proliferative zone. (C, F) The number of proliferating cell in M-phase (PH3+) co-expressing OLIG2+ was unchanged in both the VZ and SVZ of the MGE/AEP in Dlx1&2 mutants compared to wildtype mice. The graph depicts the average number (±SEM) of PH3+ (red) or PH3+/OLIG2+ (yellow) cells in the VZ and SVZ of the MGE/AEP at E12.5 (n=3) and E15.5 (n=3) calculated from Dlx1&2 mutant (shaded color) and comparable wildtype sections. (G–H) Coronal sections from E12.5 wildtype (G–G″) or Dlx1&2 mutants (H–H″) were double-labeled for Ki67 (green) and PDGFRα (red). The boxed region in (G′–H′) is shown at higher magnification in (G″–H″). The number of PDGFRα cells is increased in the medioventral MGE (the VTOP domain), whereas the number of proliferating Ki67+ cells is decreased in this region. Of note, there is an increase in PDGFRα+ cells in the VZ of the Dlx1&2 mutants, with no appreciable change in Ki67 expression, suggesting precocious formation of OPCs. Over-expression of DLX1&2 in telencephalic cells reduces OLIG2 expression (I–J) E13.5 Dlx1&2 mutant brain slice electroporated with expression constructs for GFP alone (I–I′) or GFP+DLX1+DLX2 (J–J′) were cultured for 60 hours, resectioned, and doubled-labeled for GFP (green) and OLIG2 (red) and visualized by confocal microscopy. A low magnification brightfield image of the cultured slice overlaid with a false-colored (purple) representation of the GFP autofluorescence is shown as an inset in I and J. There is minimal co-expression of GFP and OLIG2 in slices electroporated with GFP+DLX1+DLX2 (J–J′) compared to the extent of co-expression of GFP and OLIG2 in slices electroporated with GFP (I–I′). Boxed region in (I, J) is shown at higher magnification in (I′, J′). In (I′,J′) z-stack of the x-axis corresponding to the horizontal line is shown above the image, and a z-stack of the y-axis corresponding to the vertical line is shown to the right of the image. Arrows point to cells that co-express GFP and OLIG2. Arrowhead points to a GFP+ cell that lies on top of a OLIG2+ cell. Scale bars A–B, D–E, G′–H′ = 50μm Scale bars G–J = 100μm Scale bars G″–H″ = 25μm Scale bar I′–J′ = 20μm
Figure 6
Figure 6. Increased OPC formation is commensurate with decreased neuron formation in Dlx1&2 mutants
(A–C, A′–C′) OPC formation is increased at E11.5 in the MGE of Dlx1&2 mutants (−/−, A′–C′) compared to wildtype (+/+, A–C). In situ hybridization for Olig2 (A–A′), Pdgfra (B–B′), and Sox10 (C–C′) shows increased expression within the MGE (brackets), which is shown at higher magnification in the lower panels. (D–K,D′–K′) Neuron formation is decreased in the MGE of Dlx1&2 mutants. The expression of pan-neuronal genes (Tubb3/Tuj1 and Stmn2/SCG10) and GABAergic neuron markers (Gad67 and Lhx6) was analyzed by in situ hybridization on coronal sections from wildtype (+/+) and Dlx1&2 mutants (−/−) at E11.5 (D–G, D′–G′) and E12.5 (H–K, H′–K′). (D–G, D′–G′) At E11.5, Tubb3, Stmn2, and GAD67 expression is decreased in the MGE of Dlx1&2 mutants (brackets). The MGE is shown at higher magnification in the bottom panels. There are fewer Lhx6+ cells (arrowheads) in the SVZ of the MGE in Dlx1&2 mutants compared to wildtype (G–G′). (H–K, H′–K′) At E12.5, expression of Tubb3, Stmn2, Gad67, and Lhx6 is diminished in the MGE of Dlx1&2 mutants. Note that the greatest decrease occurs in the ventral MGE (brackets) where OPC production is increased in Dlx1&2 mutants (see Figure 3 and 4). Scale bars: A, D, H = 200μm.
Figure 7
Figure 7. Olig2 is necessary for OPC formation in Dlx1&2 mutants, and Mash1 modulates OPC generation via Dlx1&2
In situ hybridization on E15.5 coronal forebrain sections. The genotype of the section is labeled to the left of the rows and above the columns: All top rows, wildtype for Dlx1&2. All bottom rows, homozygous mutant for Dlx1&2. (A) Left column, wildtype for Olig2; right column, homozygous mutant for Olig2. In Olig2 mutants, Olig1 expression in the VZ of the MGE/AEP was increased, while the number of Olig1+ cells in the SVZ and mantle was reduced (solid arrowhead), but not eliminated. Similarly, in Dlx1&2;Olig2 mutants, Olig1 expression was increased in the VZ and reduced in the SVZ and mantle of the VTOP domain (solid arrowhead). In comparison with Olig2 mutants, Dlx1&2;Olig2 mutants showed a much greater accumulation of Olig1+ cells in the dorsal LGE (open arrowhead). (B) Left column: wildtype for Mash1; right column: homozygous mutant for Mash1. Compared to wildtype, Olig2 expression is decreased in Mash1 mutants, particularly in the VZ of the MGE and SVZ of the AEP (solid arrowheads). Expression of Olig2 is restored and augmented in the MGE/AEP of Dlx1&2;Mash1 triple mutants, where it resembles Olig2 expression in Dlx1/2 mutants. (C–D) Left column: wildtype; middle column: homozygous mutant for Olig2; right column: homozygous mutant for Mash1. Pdgfra (C) and Sox10 (D) expression are undetectable in Olig2 mutants and Olig2;Dlx1&2 triple mutants. In Mash1 mutants, Pdgfra and Sox10 expression are reduced, particularly in the AEP (solid arrowhead) compared to wildtype, but are increased in Dlx1&2;Mash1 triple mutants even more broadly than in Dlx1&2 mutants. (E) Model of neurogenesis and oligodendrogenesis in the ventral telencephalon. A subpopulation of Olig2+ cells express Dlx1&2/±Mash1 in the VZ and SVZ1. We propose that Dlx1&2 down-regulates Olig2 in these cells to generate neuroblasts that differentiate into GABAergic neurons. Mash1 modulates oligodendrogenesis by inhibiting Dlx expression through Notch-mediated lateral inhibition in the VZ and possibly SVZ1 (blunted arrows connecting cells). In Mash1 mutants, increased expression of Dlx1&2 leads to repression of both Olig2 and OPC formation (B–D). Removal of Dlx1&2 function in Mash1;Dlx1&2 triple mutants relieves repression of OLIG2 and restores OPC production (C–D). A mechanism whereby OLIG2+/DLX2+ progenitors down-regulate Dlx-expression to produce oligodendrocytes (gray dashed arrows) is suggested by Dlx2-lineage analysis (see text).
Figure 8
Figure 8. OPCs transplanted from Dlx1&2 mutants migrate and differentiate into mature oligodendrocytes that are maintained in adult animals
(A′) Schematic of transplant experiment: GFP+ MGE/AEP cells were dissected from E15.5 Dlx1&2 mutants and wildtype mice (as described in Materials and Methods), dissociated into a cell suspension, and injected into the lateral ventricles of postnatal day 0 (P0) mice. Recipient mice were sacrificed at P30 or P60, and transplanted cells were identified by immunohistochemistry for GFP (green), DAPI (blue), and glial markers (red) as shown (A–K). (A) Overview of GFP+ cells in the corpus callosum (cc) of P30 transplant recipient. (B–E) The molecular identity of GFP+ cells in the corpus callosum was characterized by double-labeling for GFP and SOX10 (B), OLIG1 (C), MBP (D), and GFAP (E). GFP+ cells co-express proteins of maturing oligodendrocytes (arrows, SOX10, OLIG1, MBP), but not astrocytes (GFAP). (F) Overview of GFP+ cells in the corpus callosum (cc) and septum (Spt) of P60 recipient mice. (G–I) Double-labeling for GFP (green) and SOX10 (red) identifies transplanted cells in the oligodendrocyte lineage in the corpus callosum (G), fornix (H), and septum (I). (I′) higher magnification view of an oligodendrocyte in the septal grey matter. Arrows point to examples of double-labeled cells. (J–K) Double-labeling for GFP (green) and MBP (red) shows that transplanted cells mature into MBP-expressing oligodendrocytes in the corpus callosum (J) and septum (K). Scale bars: A, F = 100μm; B, E, G–I, K = 50μm; C–D, I′–J = 20μm.

References

    1. Agius E, Soukkarieh C, Danesin C, Kan P, Takebayashi H, Soula C, Cochard P. Converse control of oligodendrocyte and astrocyte lineage development by Sonic hedgehog in the chick spinal cord. Dev Biol. 2004;270:308–321. - PubMed
    1. Aguirre AA, Chittajallu R, Belachew S, Gallo V. NG2-expressing cells in the subventricular zone are type C-like cells and contribute to interneuron generation in the postnatal hippocampus. J Cell Biol. 2004;165:575–589. - PMC - PubMed
    1. Alberta JA, Park SK, Mora J, Yuk D, Pawlitzky I, Iannarelli P, Vartanian T, Stiles CD, Rowitch DH. Sonic hedgehog is required during an early phase of oligodendrocyte development in mammalian brain. Mol Cell Neurosci. 2001;18:434–441. - PubMed
    1. Alvarez-Dolado M, Calcagnotto ME, Karkar KM, Southwell DG, Jones-Davis DM, Estrada RC, Rubenstein JL, Alvarez-Buylla A, Baraban SC. Cortical inhibition modified by embryonic neural precursors grafted into the postnatal brain. J Neurosci. 2006;26:7380–7389. - PMC - PubMed
    1. Anderson S, Mione M, Yun K, Rubenstein JL. Differential origins of neocortical projection and local circuit neurons: role of Dlx genes in neocortical interneuronogenesis. Cereb Cortex. 1999;9:646–654. - PubMed

Publication types

MeSH terms

Substances