Prostaglandin E2 modulates dendritic cell function during chlamydial genital infection
- PMID: 17680801
- PMCID: PMC2433296
- DOI: 10.1111/j.1365-2567.2007.02642.x
Prostaglandin E2 modulates dendritic cell function during chlamydial genital infection
Abstract
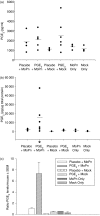
Inflammatory responses mediated by antigen-presenting dendritic cells (DCs), can be modulated by the presence of prostaglandins (PG), including prostaglandin E2 (PGE2). PGE2 modifies the production of an immune response by altering DC function through PGE2 receptors. PGE2 is produced by epithelial cells lining the murine female reproductive tract during Chlamydia muridarum infection and likely manipulates the antichlamydial immune response during antigen uptake in the genital mucosa. Our data demonstrate that the PGE2 present locally in the genital tract upon chlamydial genital infection enhanced the recruitment of CD11b+ conventional DCs, but not CD45R+ plasmacytoid DCs, to infected genital tract tissue and draining lymph nodes in vivo. Furthermore, exposure to PGE2 in vitro during infection of murine bone-marrow-derived conventional DCs (cDCs) boosted interleukin-10 mRNA and protein while not influencing interleukin-12p40 production. Infection of cDCs markedly increased mRNA production of the costimulatory molecules CD86, CD40 and a member of the C-type lectin family, DEC-205, but addition of PGE2 increased other costimulatory molecules and C-type lectins. Also, exposure of PGE2 to infected cDCs increased FcgammaRIII and FcgammaRIIb, suggesting that PGE2 enhances the uptake and presentation of C. muridarum and augments production of the antichlamydial adaptive immune response. Taken together, the data suggest that exposure of infected cDCs to PGE2 drives production of a diverse adaptive immune response with implications for regulating tissue inflammation.
Figures


Similar articles
-
Identification of dendritic cell subsets responding to genital infection by Chlamydia muridarum.FEMS Immunol Med Microbiol. 2009 Mar;55(2):226-36. doi: 10.1111/j.1574-695X.2008.00523.x. Epub 2009 Jan 12. FEMS Immunol Med Microbiol. 2009. PMID: 19159430 Free PMC article.
-
The infecting dose of Chlamydia muridarum modulates the innate immune response and ascending infection.Infect Immun. 2004 Nov;72(11):6330-40. doi: 10.1128/IAI.72.11.6330-6340.2004. Infect Immun. 2004. PMID: 15501762 Free PMC article.
-
Plasmacytoid dendritic cells modulate nonprotective T-cell responses to genital infection by Chlamydia muridarum.FEMS Immunol Med Microbiol. 2010 Apr;58(3):397-404. doi: 10.1111/j.1574-695X.2010.00653.x. Epub 2010 Jan 19. FEMS Immunol Med Microbiol. 2010. PMID: 20180848 Free PMC article.
-
The multiple faces of prostaglandin E2 G-protein coupled receptor signaling during the dendritic cell life cycle.Int J Mol Sci. 2013 Mar 25;14(4):6542-55. doi: 10.3390/ijms14046542. Int J Mol Sci. 2013. PMID: 23528886 Free PMC article. Review.
-
The role of dendritic cells in driving genital tract inflammation and HIV transmission risk: are there opportunities to intervene?Innate Immun. 2015 Jan;21(1):99-112. doi: 10.1177/1753425913513815. Epub 2013 Nov 26. Innate Immun. 2015. PMID: 24282122 Free PMC article. Review.
Cited by
-
A bovine model of respiratory Chlamydia psittaci infection: challenge dose titration.PLoS One. 2012;7(1):e30125. doi: 10.1371/journal.pone.0030125. Epub 2012 Jan 27. PLoS One. 2012. PMID: 22299031 Free PMC article.
-
Dendritic cells and macrophages in the genitourinary tract.Mucosal Immunol. 2008 Nov;1(6):451-9. doi: 10.1038/mi.2008.57. Epub 2008 Sep 10. Mucosal Immunol. 2008. PMID: 19079212 Free PMC article. Review.
-
Identification of dendritic cell subsets responding to genital infection by Chlamydia muridarum.FEMS Immunol Med Microbiol. 2009 Mar;55(2):226-36. doi: 10.1111/j.1574-695X.2008.00523.x. Epub 2009 Jan 12. FEMS Immunol Med Microbiol. 2009. PMID: 19159430 Free PMC article.
-
A vault nanoparticle vaccine induces protective mucosal immunity.PLoS One. 2009;4(4):e5409. doi: 10.1371/journal.pone.0005409. Epub 2009 Apr 30. PLoS One. 2009. PMID: 19404403 Free PMC article.
-
Monocyte-derived DC maturation strategies and related pathways: a transcriptional view.Cancer Immunol Immunother. 2011 Apr;60(4):457-66. doi: 10.1007/s00262-010-0954-6. Epub 2011 Jan 22. Cancer Immunol Immunother. 2011. PMID: 21258790 Free PMC article. Review.
References
-
- US Department of Health and Human Services DoSP. MMWR. Vol. 51. Atlanta, GA: 2002. Centers for Disease Control and Prevention Sexually Transmitted Disease 2003. RR-6.
-
- Brunham RC, Pourbohloul B, Mak S, White R, Rekart ML. The unexpected impact of a Chlamydia trachomatis infection control program on susceptibility to reinfection. J Infect Dis. 2005;192:1836–44. - PubMed
-
- Brunham RC, Rey-Ladino J. Immunology of Chlamydia infection: implications for a Chlamydia trachomatis vaccine. Nat Rev Immunol. 2005;5:149–61. - PubMed
Publication types
MeSH terms
Substances
Grants and funding
LinkOut - more resources
Full Text Sources
Other Literature Sources
Medical
Research Materials

