. 2007 Aug;13(2):203-13.
doi: 10.1016/j.devcel.2007.07.004.

Regulated HsSAS-6 levels ensure formation of a single procentriole per centriole during the centrosome duplication cycle

Affiliations

Regulated HsSAS-6 levels ensure formation of a single procentriole per centriole during the centrosome duplication cycle

Petr Strnad et al. Dev Cell. 2007 Aug.

Abstract

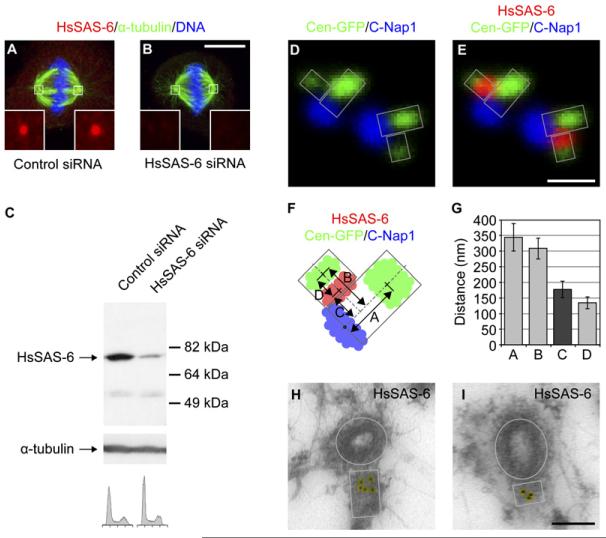
Centrosome duplication involves the formation of a single procentriole next to each centriole, once per cell cycle. The mechanisms governing procentriole formation and those restricting its occurrence to one event per centriole are poorly understood. Here, we show that HsSAS-6 is necessary for procentriole formation and that it localizes asymmetrically next to the centriole at the onset of procentriole formation. HsSAS-6 levels oscillate during the cell cycle, with the protein being degraded in mitosis and starting to accumulate again at the end of the following G1. Our findings indicate that APC(Cdh1) targets HsSAS-6 for degradation by the 26S proteasome. Importantly, we demonstrate that increased HsSAS-6 levels promote formation of more than one procentriole per centriole. Therefore, regulated HsSAS-6 levels normally ensure that each centriole seeds the formation of a single procentriole per cell cycle, thus playing a fundamental role in driving the centrosome duplication cycle and ensuring genome integrity.


Figures

Figure 1
Figure 1. HsSAS-6 Is Required for Procentriole Formation
(A—D) HeLa cells transfected with control siRNAs or siRNAs directed against HsSAS-6, stained with antibodies against centrin-3 (red) and α-tubulin (green); DNA is shown in blue. Insets are magnified 5-fold. Scale bar, 10 μm. Cells were classified into the following categories: two pairs of centrin foci, bipolar spindle (A); two single centrin foci, bipolar spindle (B); one single centrin focus, bipolar spindle (C); one single centrin focus, monopolar spindle (D). (E) Distribution of cells in the categories described above (n = 50 and n = 100 for 48 hr and 72 hr time points, respectively); Other: cells that could not be assigned to any of the four categories (∼5% of cells contained more than four centrin foci, for each experimental condition, and some cells contained a pair of juxtaposed centrin foci in the case of cells targeted with HsSAS-6 siRNAs). Note that monopolar spindle assembly was also observed with an independent siRNA (Leidel et al., 2005). (F) HeLa cells expressing centrin-GFP were treated with siRNA directed against HsSAS-6 and observed 72 hr after transfection. A cell with a monopolar spindle and single centrin focus (arrow) was first imaged by DIC and fluorescence microscopy (scale bar, 10 μm), then fixed and analyzed by serial section EM (1—6: selected sections spanning the entire centriole; scale bar, 500 nm).
Figure 2
Figure 2. HsSAS-6 Localizes to the Proximal Part of the Procentriole
(A and B) HeLa cells transfected with control siRNAs or siRNAs directed against HsSAS-6 and stained with antibodies against α-tubulin (green) and HsSAS-6 (red); DNA is shown in blue. Insets are magnified 5-fold. Scale bar, 10 μm. (C) Control siRNA and HsSAS-6 siRNA-treated HeLa whole-cell lysates were analyzed by western blot using HsSAS-6 antibodies (top); the blot was reprobed with antibodies against α-tubulin as a loading control (middle). Cells treated in the same manner were analyzed by FACS (bottom). Note that there is no significant difference in cell cycle distribution between cells treated with control and HsSAS-6 siRNAs. (D and E) HeLa cell in G2 expressing centrin-GFP and stained with antibodies against GFP (green; shown in D and E), C-Nap1 (blue; shown in D and E), and HsSAS-6 (red; shown in E). The orientation of the centrioles (large rectangles) and the procentrioles (small rectangles) is illustrated in gray. Scale bar, 500 nm. (F and G) Distances between the center of the centrin-GFP, C-Nap1, and HsSAS-6 signals (schematically represented in F) were measured for ten centriole/procentriole pairs (imaged as in E) and are reported in (G). Error bars, 95% confidence intervals. Value C is highlighted in dark gray and corresponds to the distance separating the center of the HsSAS-6 signal from the axis of the centriole (see F). (H and I) HeLa cells processed for immunoelectron microscopy and labeled with HsSAS-6 antibodies. The centriole (viewed in cross-section), oval contours, and the procentriole (viewed laterally), rectangular contours, are shown in gray, and all the gold particles are highlighted in yellow. The structure of procentrioles and centrioles is not fully preserved due to methanol fixation. Scale bar, 200 nm.
Figure 3
Figure 3. HsSAS-6 Is Recruited to the Procentriole before Centrin in a Plk4-Independent Manner
(A) HeLa cells were fixed and stained with a mixture of antibodies against PCNA, Cyclin B1 (both in green; top) and HsSAS-6 (red; bottom); DNA is shown in blue (bottom). Scale bar, 10 μm. Arrows point to centriolar HsSAS-6. (B) HeLa cells were released from a double thymidine block, fixed at the indicated time points, and stained with antibodies against centrin (green) and HsSAS-6 (red). Scale bar, 500 nm. Cells were placed into three categories based on the distribution of these two proteins: (1) two centrin foci, no HsSAS-6 (top; empty circles); (2) two centrin foci, HsSAS-6 juxtaposed next to one (image not shown) or two (middle; filled squares) centrin foci; (3) three (image not shown) or four centrin foci with HsSAS-6 localized next to two of them (bottom; empty triangles). The relative representation of each category is shown in the graph (top; 100 cells counted for each time point). The DNA content of cells from each time point was analyzed by FACS (bottom). (C and D) HeLa cell expressing centrin-GFP and stained with antibodies against GFP (green; shown in C and D), C-Nap1 (blue; shown in C and D), and HsSAS-6 (red; shown in D). The orientation of the centrioles (rectangles) is illustrated in gray. Scale bar, 500 nm. (E and F) HeLa cells transfected with control siRNAs or siRNAs directed against Plk4, fixed after 72 hr and stained with antibodies against centrin (green) and HsSAS-6 (red); DNA is shown in blue. Cells with a high cytoplasmic signal of HsSAS-6 were scored. Insets are magnified 5-fold. Scale bar, 10 μm.
Figure 4
Figure 4. HsSAS-6 Protein Levels Are Cell-Cycle Regulated
(A) HeLa cells released from a double thymi-dine block and analyzed at the indicated time points by FACS for DNA content (bottom) and by western blot using HsSAS-6 antibodies (top). The membrane was also probed with antibodies against α-tubulin as a loading control (middle). Unsynchronized cells (Uns) were processed in parallel. (B) HeLa cells were released from a double thymidine block and RNA was isolated at the indicated time points. HsSAS-6 mRNA levels were analyzed by quantitative RT-PCR, with values being expressed relative to the total RNA amount (top). Error bars, 95% confidence intervals. Cells from each time point were also analyzed by FACS for DNA content (bottom). (C) HeLa cells at the indicated stages were fixed and stained with antibodies against Cyclin B1 (green) and HsSAS-6 (red). DNA is shown in blue. Scale bar, 10 μm. (D) Cells were processed as in (C) and the average cytoplasmic signal intensity of metaphase, anaphase, telophase, and G1 cells was quantified (n = 10; error bars, 95% confidence intervals). Note that while Cyclin B1 levels drop already in anaphase, those of HsSAS-6 start dropping during telophase.
Figure 5
Figure 5. HsSAS-6 Degradation Is Mediated by the 26S Proteasome and Depends on a KEN Box
(A and B) HeLa cells 10 hr after release from a thymidine block were treated with MG132 or DMSO alone (Control) for 30 min, fixed, and stained with antibodies against HsSAS-6 (red). DNA is shown in blue. Telophase cells were picked based on DNA staining and imaged, and the average cytoplasmic HsSAS-6 signal was quantified (n = 10; arbitrary units; errors represent 95% confidence intervals). Scale bar, 10 μm. (C) Schematic representation of HsSAS-6 fragments: N-ter (aa 1–173), C-ter (aa 148–657), and C-ter-ΔKEN (aa 148–657; K589A, E590A, N591A). The putative D boxes are indicated in black; the predicted coiled-coil domain, in gray; and the KEN box, in red. (D–F) Dual GFP fluorescence and phase-contrast time lapse microscopy of HeLa cells expressing GFP-HsSAS-6N-ter (D), GFPHsSAS-6C-ter (E), or GFP-HsSAS-6C-ter-ΔKEN (F). Time 0 min corresponds to the metaphase to anaphase transition. See also Movies S1–S3. Scale bar, 10 μm. (G) HeLa cells were transfected with Myc-Cdh1 and treated with aphidicolin (for 48 hr) starting 24 hr after transfection. The average cytoplasmic HsSAS-6 signal was quantified for randomly picked transfected cells and their nontransfected neighbors (n = 10; arbitrary units; errors represent 95% confidence intervals). Scale bar, 10 μm. Note that we performed staining with PCNA antibodies (data not shown) to verify that cells transfected with Myc-Cdh1 are arrested in S phase, as previously reported (Sorensen et al., 2000). Note also that the arbitrary units in (G) cannot be compared to those in (A) and (B), because the imaging was performed under different conditions in the two experiments.
Figure 6
Figure 6. HsSAS-6 Levels Must Be Limited to Restrict Procentriole Formation
(A and B) U2OS cells transfected with HsSAS-6 or HsSAS-6-ΔKEN, fixed after 72 hr and stained with antibodies against centrin (green) and HsSAS-6 (red). Representative images of cells without (A) or with (B) excess centrin foci are shown. (C) Cells transfected with GFP, HsSAS-6, or HsSAS-6-ΔKEN fixed after 72 hr and stained with antibodies against centrin and GFP or centrin and HsSAS-6. The number of centrin foci in GFP-positive cells (for GFP) or in cells with elevated HsSAS-6 levels (for HsSAS-6 and HsSAS-6-ΔKEN) was quantified (n ≥ 100 for each of three independent experiments). Error bars, 95% confidence intervals. (D) HeLa cells were cotransfected with GFP and HsSAS-6 or GFP and HsSAS-6-ΔKEN, and HsSAS-6 levels were analyzed after 48 hr by western blot. GFP was used as a transfection and loading control. The images are from one membrane and a single exposure. Note that there is significantly more HsSAS-6 accumulating in cells expressing HsSAS-6-ΔKEN, as compared with HsSAS-6. (E and F) U2OS cells transfected with HsSAS-6-ΔKEN, fixed after 24 hr and stained with antibodies against centrin (green, shown in E and F) and HsSAS-6 (red, shown in E) or Odf2 (red, shown in F). Arrows point to a centriole that seeds formation of three (E) or two (F) centrin foci. Scale bar, 500 nm. (G) U2OS cells expressing centrin-GFP were transfected with HsSAS-6-ΔKEN. Seventy-two hours later, cells were screened using fluorescence microscopy (top panel; arrow points to the area shown on the EM images below; note also the other centrin-GFP focus), fixed, and analyzed by serial section EM (1–4: selected sections spanning the entire centriole and associated procentrioles; scale bar, 500 nm). Arrows point to the centriole; arrowheads, to procentrioles, three of which are present in this particular case.
Figure 7
Figure 7. HsSAS-6 Level Oscillations Are Crucial for the Centrosome Duplication Cycle
Schematic representation of HsSAS-6 distribution during the cell cycle. Red disks represent HsSAS-6; green disks, centrin; blue disks, C-Nap1; and gray diamonds, active APC/C; one centriole/procentriole pair is shown in opaque in M phase. HsSAS-6 is absent in G1 and is first clearly detected in S phase when it is recruited before centrin in an asymmetric position next to the proximal end of the centriole. As cells progress through S phase and G2, HsSAS-6 accumulates further until it is degraded after ubiquitination by APC/CCdh1. Our findings indicate that the presence of HsSAS-6 in S phase is essential for procentriole formation, whereas its degradation during M phase is essential for limiting procentriole formation to one event per centriole at each cell cycle.

References

    1. Adams IR, Kilmartin JV. Localization of core spindle pole body (SPB) components during SPB duplication in Saccharomyces cerevisiae. J. Cell Biol. 1999;145:809–823. - PMC - PubMed
    1. Byers B, Goetsch L. Duplication of spindle plaques and integration of the yeast cell cycle. Cold Spring Harb. Symp. Quant. Biol. 1974;38:123–131. - PubMed
    1. Chretien D, Buendia B, Fuller SD, Karsenti E. Reconstruction of the centrosome cycle from cryoelectron micrographs. J. Struct. Biol. 1997;120:117–133. - PubMed
    1. Dammermann A, Muller-Reichert T, Pelletier L, Habermann B, Desai A, Oegema K. Centriole assembly requires both centriolar and pericentriolar material proteins. Dev. Cell. 2004;7:815–829. - PubMed
    1. Euteneuer U, Graf R, Kube-Granderath E, Schliwa M. Dictyostelium gamma-tubulin: molecular characterization and ultra-structural localization. J. Cell Sci. 1998;111:405–412. - PubMed

Publication types

Substances

LinkOut - more resources