. 2007 Aug;133(2):619-31.
doi: 10.1053/j.gastro.2007.05.018. Epub 2007 May 21.

Granulocyte-colony stimulating factor promotes liver repair and induces oval cell migration and proliferation in rats

Affiliations

Granulocyte-colony stimulating factor promotes liver repair and induces oval cell migration and proliferation in rats

Anna C Piscaglia et al. Gastroenterology. 2007 Aug.

Abstract

Background and aims: Hepatic regeneration is a heterogeneous phenomenon involving several cell populations. Oval cells are considered liver stem cells, a portion of which derive from bone marrow (BM). Recent studies have shown that granulocyte-colony stimulating factor (G-CSF) may be effective in facilitating liver repair. However, it remains unclear if G-CSF acts by mobilizing BM cells, or if it acts locally within the liver microenvironment to facilitate the endogenous restoration program. In the present study, we assessed the involvement of G-CSF during oval cell activation.

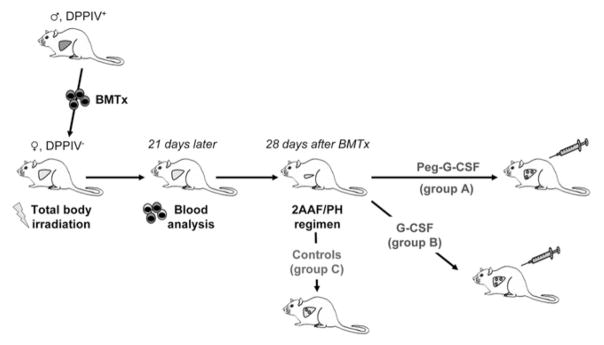
Methods: Dipeptidyl-peptidase-IV-deficient female rats received BM transplants from wild-type male donors. Four weeks later, rats were subjected to the 2-acetylaminofluorene/partial hepatectomy model of oval cell-mediated liver regeneration, followed by administration of either nonpegylated G-CSF or pegylated G-CSF. Control animals did not receive further treatments after surgery. The magnitude of oval cell reaction, the entity of BM contribution to liver repopulation, as well as the G-CSF/G-CSF-receptor expression levels were evaluated. In addition, in vitro proliferation and migration assays were performed on freshly isolated oval cells.

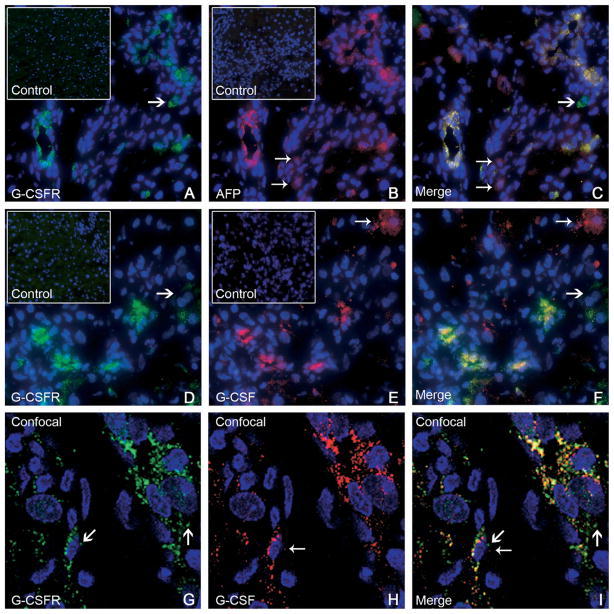
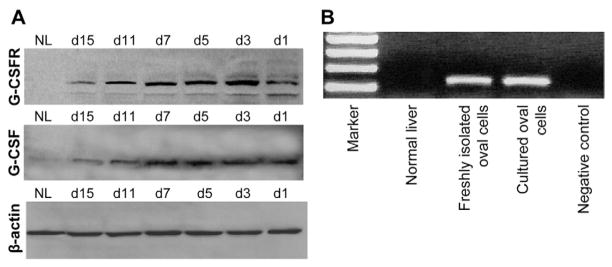
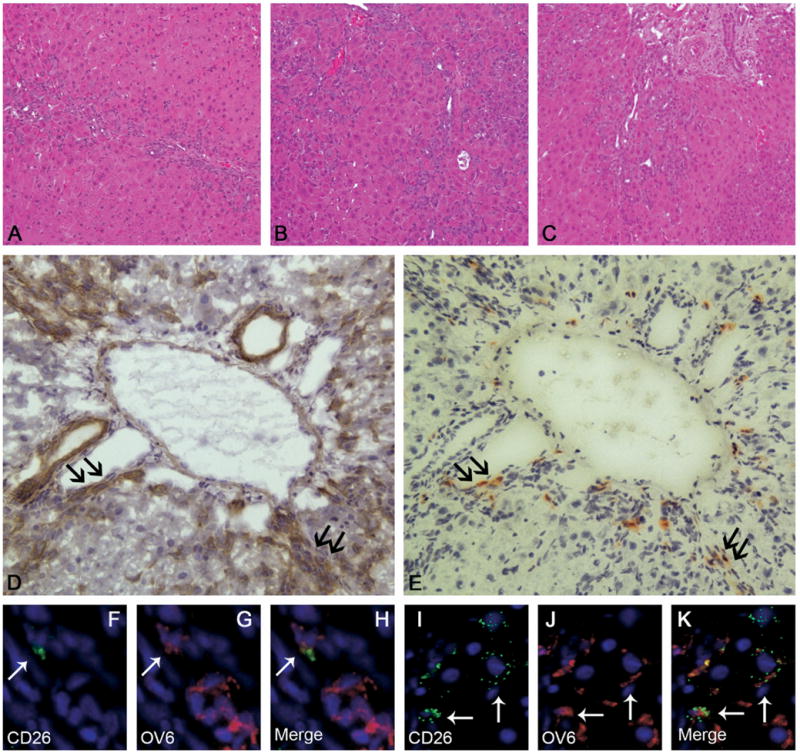
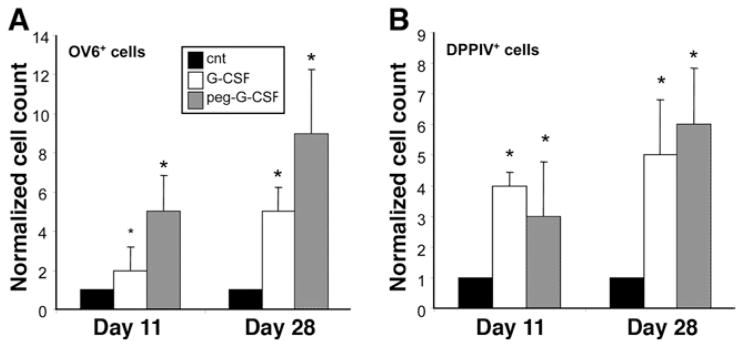
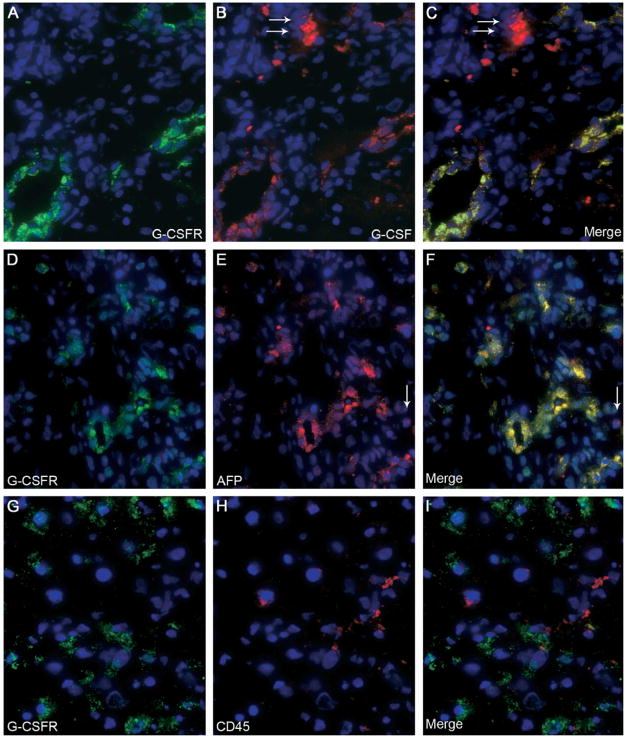
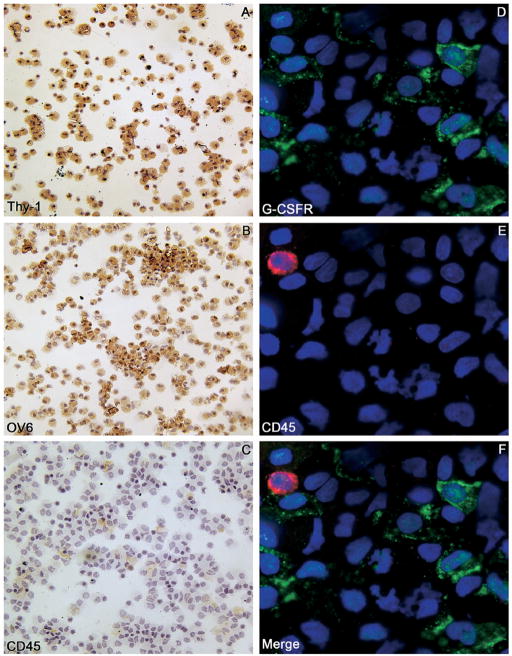
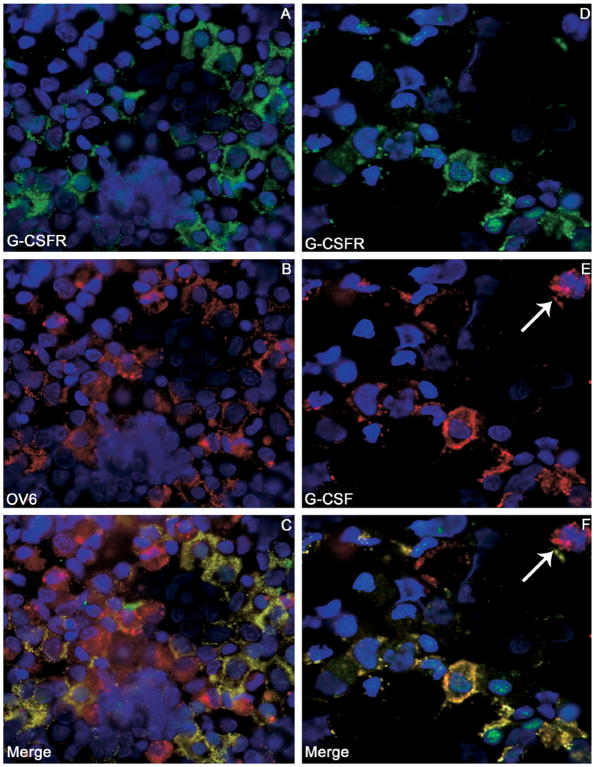
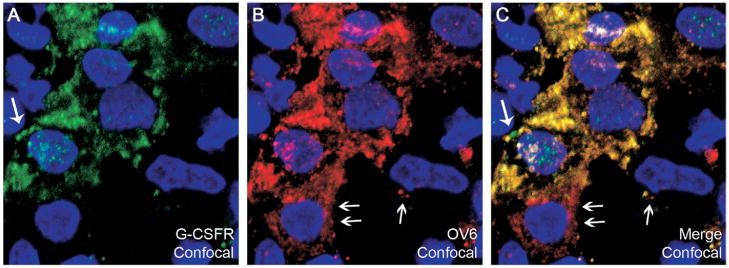
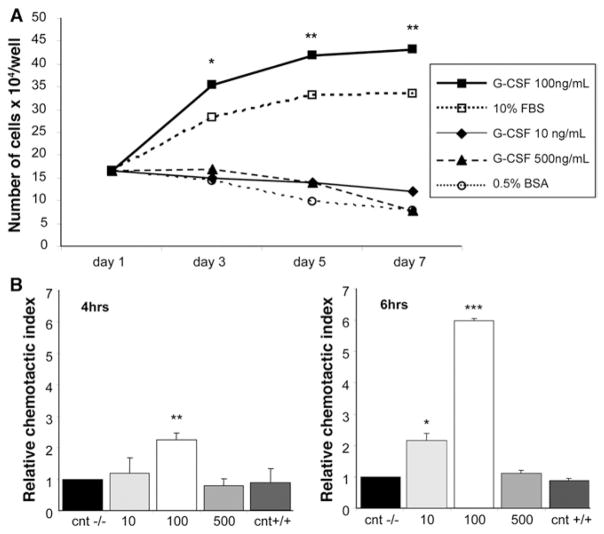
Results: Oval cells were found to express G-CSF receptor and G-CSF was produced within the regenerating liver. G-CSF administration significantly increased both the magnitude of the oval cell reaction, and the contribution of BM to liver repair. Finally, G-CSF acted as a chemoattractant and a mitogen for oval cells in vitro.

Conclusions: We have shown that G-CSF facilitates hepatic regeneration by increasing the migration of BM-derived progenitors to the liver, as well as enhancing the endogenous oval cell reaction.


Figures

Figure 1
Figure 1
Experimental design. DPPIV-female rats were exposed to total body γ-irradiation, before BMTx. BMCs were isolated from wild-type male rats and transplanted into recipient rats. Three weeks later, donor contribution to BM reconstitution was assessed. Four weeks after BMTx, chimeric animals were implanted with a 2AAF pellet, and 7 days later rats underwent PH. After surgery, animals were administered Peg–G-CSF (group A), or nonpegylated G-CSF (group B). Control rats did not receive any further treatment (group C).
Figure 2
Figure 2
(AC) Double-immunofluorescence staining of livers from group C (11 days after 2AAF/PH) showed expression of (A) G-CSFR (green), (B) AFP (red), and (C) co-expression (yellow) by many periportal cells. A few cells expressed AFP alone (small arrows, 2B and 2C), or G-CSFR alone (large arrows, 2A and 2C). The inserts in A and B represent isotype controls for G-CSFR and AFP, respectively. Cell nuclei were stained with DAPI (blue). Original magnification, 40× objective. (DF) Double-immunofluorescence staining of livers from group C (11 days after 2AAF/PH) detected cells expressing (D) G-CSFR (green), (E) G-CSF (red), and (F) co-expression (yellow) in many periportal cells. A few cells expressed G-CSFR alone (large arrows, 2D and 2F) or G-CSF alone (small arrows, 2E and 2F). The inserts in D and E represent isotype controls for G-CSFR and G-CSF, respectively. Cell nuclei were stained with DAPI (blue). Original magnification, 40× objective. (GI) Confocal microscopy was used on representative sections from the same animals (group C). Immunofluorescence for (G) G-CSFR (green) and (H) G-CSF (red) shows (I) co-expression (merge) within many periportal cells. The presence of dual markers (yellow) is evident in most cells shown. Both G-CSFR and G-CSF also were seen as distinct colors in separate cellular domains, denoting differential distribution within the cell (large arrows and small arrows, respectively). Cell nuclei were stained with DAPI (blue). Original magnification, 63× objective.
Figure 3
Figure 3
(A) Western blot analysis of liver homogenates confirmed the expression of both G-CSF and G-CSFR after 2AAF/PH in rats (at days 1, 3, 5, 7, 11, and 15 after surgery) vs normal liver (NL). G-CSFR was not produced by NL, whereas its expression was induced after OC activation, with a peak at days 3–7 after PH. G-CSF production also was increased after 2AAF/PH, peaking at days 5–7 after PH. (B) RT-PCR amplification of G-CSFR mRNA in normal liver, freshly isolated OCs, and cultured OCs provide further proof of the expression of G-CSFR by hepatic OCs.
Figure 4
Figure 4
H&E staining of liver sections 11 days after 2AAF/PH in (A) control animals (group C), (B) after G-CSF treatment (group B), and (C) after Peg–G-CSF administration (group A). At the peak of the OC reaction, the number of OCs was significantly higher in animals treated with G-CSF or Peg–G-CSF as compared with controls. Original magnification, 10× objective. (D and E) Representative serial sections stained for OV6 and DPPIV in the liver of a BMTx/2AAF/PH rat treated with exogenous G-CSF (group A). The expression of DPPIV represents a specific marker of BM donor–derived cells. (E) Right panel shows expression of DPPIV on many small, periportal cells (red–orange). (D) The corresponding serial section depicted in the left panel shows that many of the DPPIV+ cells also express the OC marker OV6 (brown), and therefore may be considered BM-derived OCs. Black arrows indicate the same cells on each figure. Original magnification, 20× objective. (FK) Double-immunofluorescence staining of liver from group A (11 days after 2AAF/PH) detected cells expressing (anti-DPPIV, 4F and 4I, green) CD26, (4G and 4J, red) OV6, and (4H and 4K, yellow) co-expression in many periportal cells (⇐). Cell nuclei were stained with DAPI (blue). Original magnification, 40× objective.
Figure 5
Figure 5
(A) Average OV6+ cells/field in livers of animals treated with either pegylated or nonpegylated G-CSF at 11 and 28 days after 2AAF/PH, as compared with 2AAF/PH alone (CNT). (B) Average DPPIV+ cells/field in livers of animals treated with either pegylated or nonpegylated G-CSF at 11 and 28 days after 2AAF/PH, as compared with 2AAF/PH alone (cnt). Data represent the mean value + SD of cell counts, normalized with respect to control. *P < .05. At day 11 after 2AAF/PH, the magnitude of the OC reaction was increased up to 5 times in animals treated with Peg–G-CSF as compared with controls. At day 28, when only a few OCs still were present in 2AAF/PH controls, the number of liver OCs remained significantly higher in G-CSF– and Peg–G-CSF–treated rats (up to 9-fold increase). Similarly, the number of donor-derived BMCs engrafted into the livers of G-CSF– and Peg–G-CSF–treated animals was proportionally higher at each time point, reaching a 4-fold increase at day 11 and a 6-fold increase at day 28 after PH.
Figure 6
Figure 6
(AC) Double-immunofluorescence staining on liver section 11 days after 2AAF/PH/G-CSF treatment (group B) detected (A) G-CSFR (green), (B) G-CSF (red), and (C) co-expression (yellow) by many periportal cells. A few cells expressed G-CSF alone (⇐, 6B and 6C). (DF) Double-immunofluorescence staining of liver 11 days after 2AAF/PH/G-CSF treatment (group B) showed expression of (D) G-CSFR (green), (E) AFP (red), and (F) co-expression (yellow) by many periportal cells. A few cells expressed AFP alone (⇐, 6E and 6F). (GI) Double-immunofluorescence staining of liver 11 days after 2AAF/PH/G-CSF treatment (group B) detected (G) G-CSFR (green) and (H) CD45 (red). (I) The merge of panels G and H showed that G-CSFR+ cells were mostly CD45, thereby excluding the possibility of significant hematopoietic cell contamination. Cell nuclei were stained with DAPI (blue). Original magnification, 40× objective.
Figure 7
Figure 7
(AC) Thy-1+ sorted cell cytospins stained for (A) Thy-1, (B) OV6, and (C) CD45. Most of the sorted cells were OV6+ and Thy-1+, whereas a very few hematopoietic cells (CD45+) were observed. (DF) Double-immunofluorescence staining of Thy-1+ sorted cell cytospins show (D) G-CSFR (green) and (E) the hematopoietic marker CD45 (red). Numerous Thy-1+ cells expressed G-CSFR (~59%), whereas the degree of hematopoietic cell contamination was negligible. (F) The merge of panels D and E showed that the few CD45+ cells were G-CSFR. Cell nuclei were stained with DAPI (blue). Original magnification, 100× objective.
Figure 8
Figure 8
(AC) Double-immunofluorescence staining of Thy-1+ sorted cell cytospins showed the expression of (A) G-CSFR (green) and (B) the OC marker OV6 (red). Most of the sorted cells were OV6 positive (~86%), and a majority also expressed G-CSFR (~59%). (C) The merge of panels A and B showed that all of the G-CSFR+ cells also expressed OV6. (DF) Double-immunofluorescence staining of Thy-1+ sorted cell cytospins stained for (D) G-CSFR (green) and (E) G-CSF (red). (F) The merge of panels D and E shows that most of the Thy-1 sorted cells co-expressed G-CSF and G-CSFR (yellow), whereas a few were only G-CSF+ (⇐). Cell nuclei were stained with DAPI (blue). Original magnification, 100×.
Figure 9
Figure 9
(AC) Confocal microscopy of double-immunofluorescence staining of Thy-1+ sorted cell cytospins for (A) G-CSFR (green), (B) OV6 (red), and (C) co-expression (yellow). Note that the distribution of these proteins within the cell is not identical (large and small arrows, respectively). Cell nuclei were stained with DAPI (blue). Confocal magnification, 252× (63× objective combined with 4× digital zoom).
Figure 10
Figure 10
(A) Effects of G-CSF on OC proliferation. OCs were incubated in IMDM medium supplemented with 10% fetal bovine serum (□), or serum-free IMDM medium containing 0.5% bovine serum albumin with G-CSF at 10 ng/mL (◆), 100 ng/mL (■), 500 ng/mL (▲), or without G-CSF (○, negative control) for the indicated times. Differences were statistically significant when comparing 100 ng/mL G-CSF vs negative controls. *P < 0.05, **P < .005. (B) Effect of G-CSF on OC migration in transwells. OCs were seeded in the top chamber with 10, 100, or 500 ng/mL G-CSF placed in the bottom chamber, or 100 ng/mL of G-CSF placed in both chambers (CNT+/+, chemokinetic control). Migration controls were used with no G-CSF in either chamber (cnt−/−). Data represent the mean value + SD of 3 independent experiments, normalized with respect to control migration (relative chemotactic index; *P < .05, **P < .01, ***P < .0001). When G-CSF was added to the lower chamber, OCs crossed the filter in a dose-dependent manner, reaching a peak in the presence of 100 ng/mL of G-CSF (>6-fold increase after 6 hours).

Similar articles

Cited by

References

    1. Shackel NA, Rockey DC. Stem cells and liver disease: promise laced with confusion and intrigue. Gastroenterology. 2004;127:346–348. - PubMed
    1. Lowes KN, Croager EJ, Olynyk JK, Abraham LJ, Yeoh GC. Oval cell-mediated liver regeneration: role of cytokines and growth factors. J Gastroenterol Hepatol. 2003;18:4–12. - PubMed
    1. Libbrecht L, Desmet V, Van Damme B, Roskams T. Deep intralobular extension of human hepatic progenitor cells correlates with parenchymal inflammation in chronic viral hepatitis: can progenitor cells migrate? J Pathol. 2000;192:373–378. - PubMed
    1. Crosbie OM, Reynolds M, McEntee G, Traynor O, Hegarty JE, O’Farrelly C. In vitro evidence for the presence of hematopoietic stem cells in the adult human liver. Hepatology. 1999;29:1193–1198. - PubMed
    1. Petersen BE, Bowen WC, Patrene KD, Mars WM, Sullivan AK, Murase N, Boggs SS, Greenberger JS, Goff JP. Bone marrow as a potential source of hepatic oval cells. Science. 1999;284:1168–1170. - PubMed

Publication types

MeSH terms

Substances