. 2007 Aug;133(2):647-58.
doi: 10.1053/j.gastro.2007.05.022. Epub 2007 May 21.

MicroRNA-21 regulates expression of the PTEN tumor suppressor gene in human hepatocellular cancer

Affiliations

MicroRNA-21 regulates expression of the PTEN tumor suppressor gene in human hepatocellular cancer

Fanyin Meng et al. Gastroenterology. 2007 Aug.

Abstract

Background and aims: microRNAs (miRNAs) are short noncoding RNAs that regulate gene expression negatively. Although a role for aberrant miRNA expression in cancer has been postulated, the pathophysiologic role and relevance of aberrantly expressed miRNA to tumor biology has not been established.

Methods: We evaluated the expression of miRNA in human hepatocellular cancer (HCC) by expression profiling, and defined a target gene and biologically functional effect of an up-regulated miRNA.

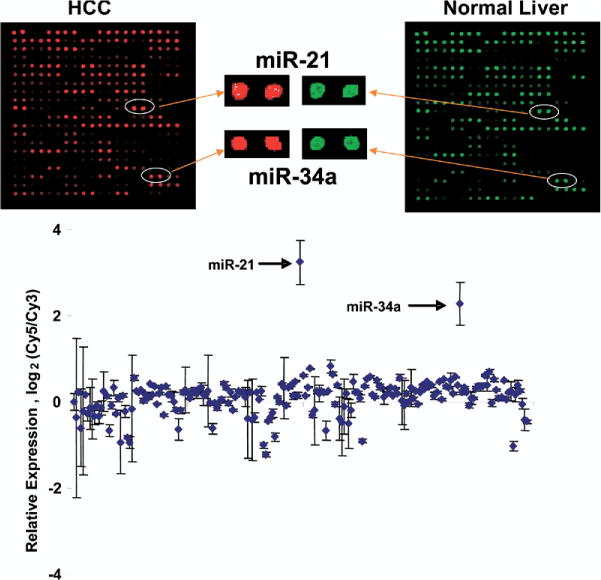
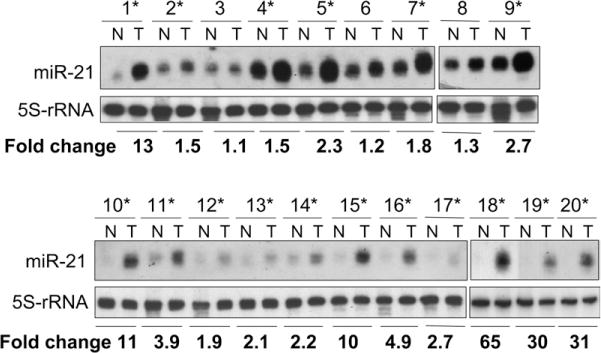
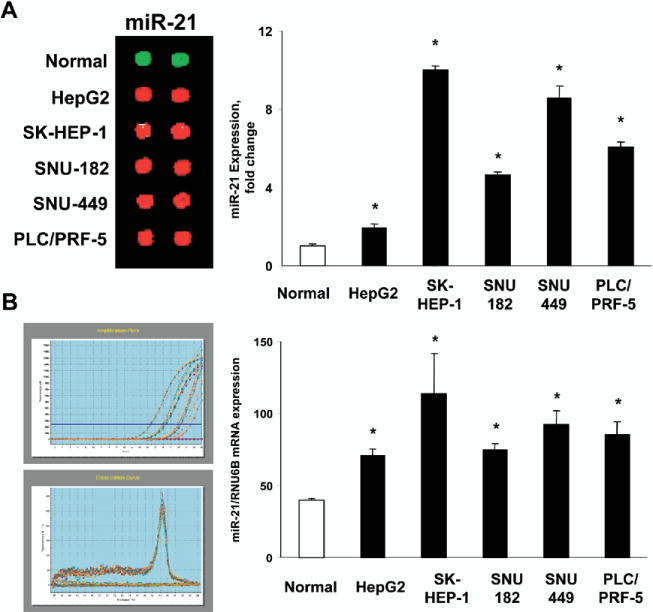
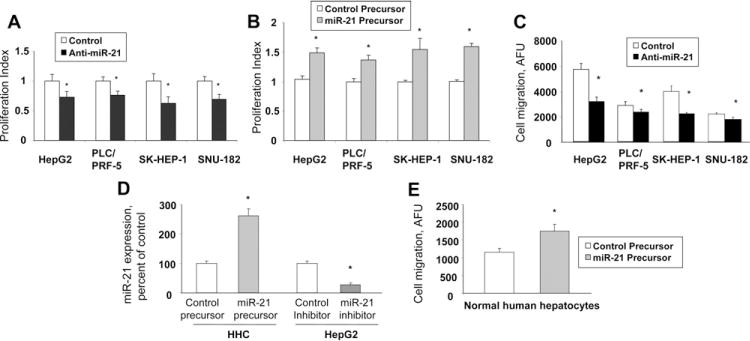
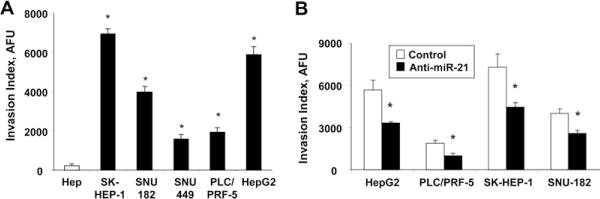
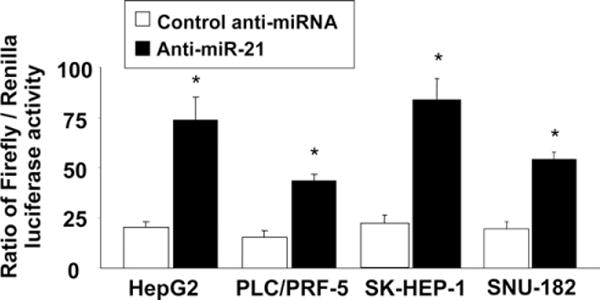
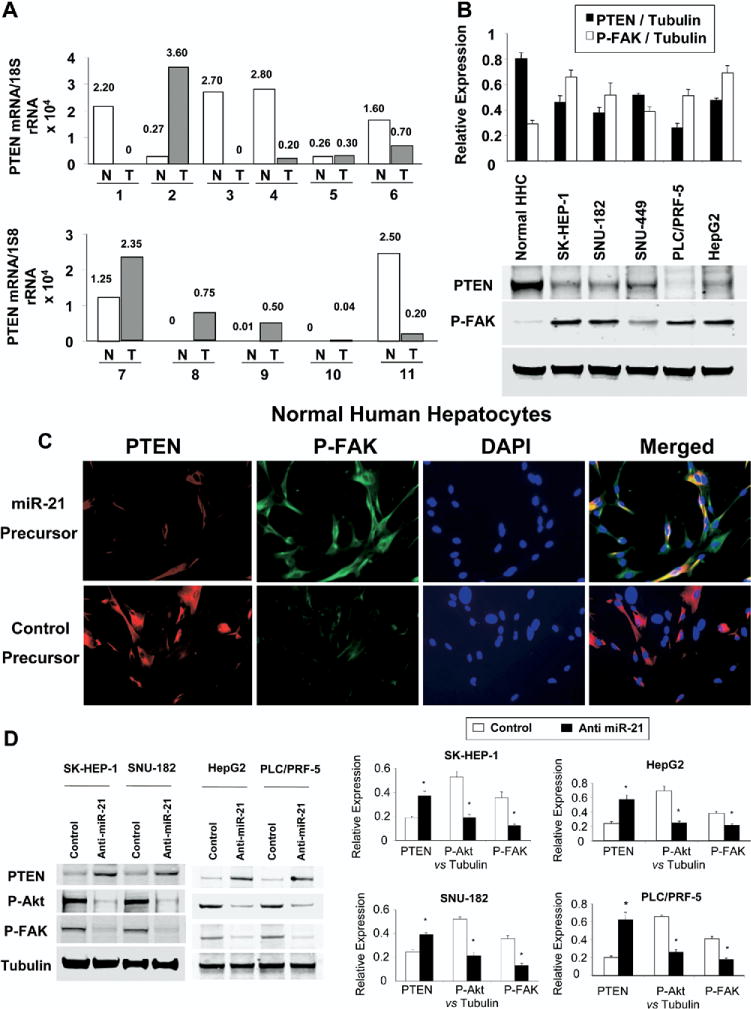
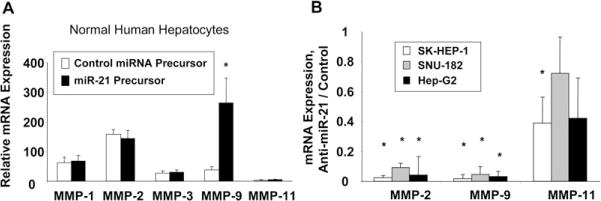
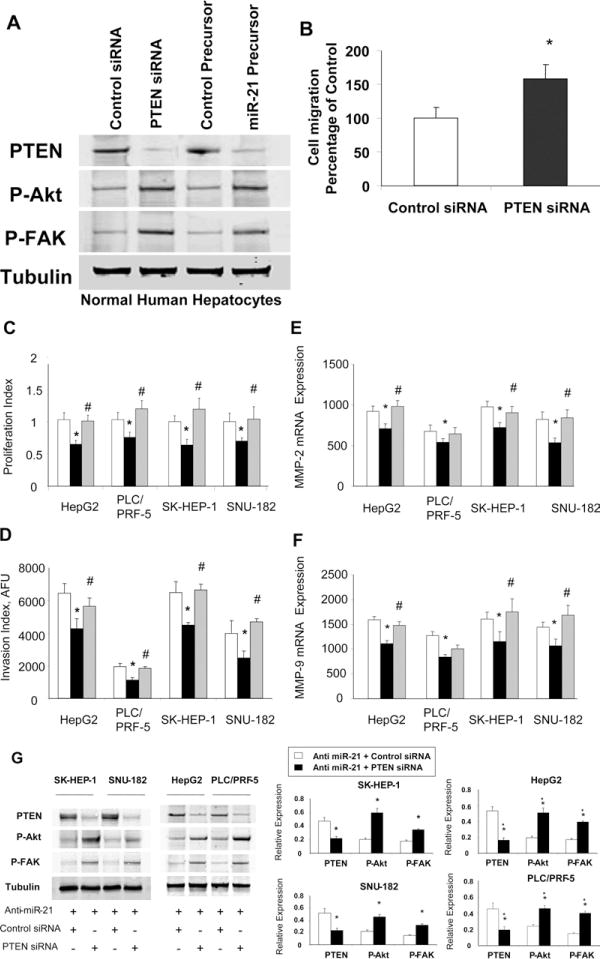
Results: miR-21 was noted to be highly overexpressed in HCC tumors and cell lines in expression profiling studies using a miRNA microarray. Inhibition of miR-21 in cultured HCC cells increased expression of the phosphatase and tensin homolog (PTEN) tumor suppressor, and decreased tumor cell proliferation, migration, and invasion. In contrast-enhanced miR-21 expression by transfection with precursor miR-21 increased tumor cell proliferation, migration, and invasion. Moreover, an increase in cell migration was observed in normal human hepatocytes transfected with precursor miR-21. PTEN was shown to be a direct target of miR-21, and to contribute to miR-21 effects on cell invasion. Modulation of miR-21 altered focal adhesion kinase phosphorylation and expression of matrix metalloproteases 2 and 9, both downstream mediators of PTEN involved in cell migration and invasion.

Conclusions: Aberrant expression of miR-21 can contribute to HCC growth and spread by modulating PTEN expression and PTEN-dependent pathways involved in mediating phenotypic characteristics of cancer cells such as cell growth, migration, and invasion.


Figures

Figure 1
Figure 1
miRNA expression profiles in human malignant and nonmalignant liver tissues and cells. miRNA was isolated and profiling was performed as described in the Materials and Methods section by hybridization to miRNA-specific probes on epoxy-coated slides. Samples from normal liver tissues were labeled with Cy3, whereas HCC tumor samples were labeled with Cy5 (n = 8). Representative chip images and spots for selected miRNA that have increased expression are illustrated. The data in the bottom panel represent the average ± standard errors of the log2 of the ratios of Cy5/Cy3 fluorescence intensity for each specific miRNA.
Figure 2
Figure 2
miR-21 is up-regulated in human primary HCC. Total RNA was isolated from HCC (T) and matching control (N), and Northern blot analysis was performed as described in the Materials and Methods section. The signal in each lane was quantified by Kodak Imaging software and the ratio of miR-21 to 5S ribosomal RNA was determined. Asterisks denote human primary HCC in which mir-21 is up-regulated. In the first 9 samples the signal is higher because more RNA (20 μg) was loaded. For samples 10–20, 10 μg of RNA was loaded.
Figure 3
Figure 3
Increased expression of miR-21 in HCC cell lines. miRNA were isolated from normal human hepatocytes and from 5 HCC cell lines. (A) miRNA was labeled and analyzed by miRNA microarray. Representative hybridization spots for miR-21 are illustrated on the left whereas quantitative expression data from 4 separate studies, each in duplicate, is shown in the right panel. (B) Quantitative real-time PCR for miR-21 was performed using a TaqMan microRNA Assay kit. Representative amplification plots and disassociation curves are shown on the left, whereas quantitative data representing the mean and SD from 3 experiments performed in triplicate are presented in the bar graph on the right. The expression of miR-21 was normalized to that of the U6B small nuclear RNA gene (RNU6B) control. *P < .05 compared with expression in normal hepatocytes.
Figure 4
Figure 4
Modulation of cell proliferation and migration by miR-21. (A) HCC cells were transfected with either 30 nmol/L miR-21–specific inhibitor (■) or control miRNA inhibitors (□), and the proliferation index was assessed after 72 hours. (B) HCC cells were transfected with either 30 nmol/L miR-21 precursors (grey bars), or control miRNA precursors (□), and the proliferation index was assessed after 72 hours. (C) HCC cells were transfected with anti–miR-21 (■) or control inhibitor (□). Cell migration across a membrane with 8-μm pores was assessed as described in the Materials and Methods section and is expressed as arbitrary fluorescence units (AFU). (D) miR-21 expression was assessed by real-time PCR in normal human hepatocytes (HHC) transfected with either control or mir-21 precursors, or in HepG2 cells transfected with control or anti–miR-21 inhibitors. (E) Normal human hepatocytes were transfected with mir-21 precursor (grey bars) or control miRNA precursor (□), and cell migration was assessed. The mean and standard error from 4 separate experiments are illustrated. *P < .05 when compared with controls.
Figure 5
Figure 5
Regulation of cell invasion by miR-21. (A) Normal human hepatocytes (HEP) or HCC cells (5 × 10⁴) were seeded in 96-well plates precoated with extracellular matrix, and cell invasion was assessed as described in the Materials and Methods section. The invasion index is expressed as arbitrary fluorescence units (AFU). The cell lines varied in their ability to invade extracellular matrix. (B) HCC cells were transfected with 30 nmol/L anti–miR-21 (■) or control inhibitor (□), and cell invasion was assessed after 72 hours. Anti–miR-21 decreased cell invasion in all 4 cell lines. The results shown represent the mean ± standard error from 4 independent experiments. *P < .05 when compared with controls.
Figure 6
Figure 6
PTEN is a target for miR-21. HCC cells were plated in 6-well plates. Cells were transfected with 1 μg of a Renilla luciferase expression construct pRL-TK and 1 μg of the pGL3-PTEN-3′-UTR firefly luciferase expression construct, along with either anti–miR-21 or control inhibitor. An increase in relative firefly luciferase activity in the presence of anti-miR-21 indicates that the 3′-UTR of PTEN contains a target that is modulated by miR-21. Data represent mean ± standard error from 8 separate determinations. *P < .05 when compared with controls.
Figure 7
Figure 7
miR-21 regulates expression of PTEN and downstream kinases. (A) Real-time PCR for PTEN expression was assessed in RNA obtained from 11 HCC tumors (gray bars) and matching nontumoral sections (□). The normalized ratio of PTEN expression is indicated above each bar. (B) Cell lysates were obtained from normal human hepatocytes and HCC cell lines cultured in 100-mm culture dishes. Immunoblot analysis was performed for PTEN and for FAK activation using phosphorylation-state dependent antibodies. The blots were stripped and reprobed for α-tubulin as a loading control and for quantitation. Representative immunoblots are shown along with quantitative data showing the mean ± standard error from 4 separate blots. *P < .05 relative to expression in normal hepatocytes. (C) Normal human hepatocytes were transfected with 30 nmol/L miR-21 precursor or control. Immunocytochemistry for PTEN and phosphorylated FAK was performed after 72 hours. A decrease in PTEN expression along with an increase in FAK phosphorylation is observed in cells transfected with miR-21 precursor compared with controls. (D) HCC cells were transfected with 30 nmol/L anti–miR-21 or control inhibitor. Cell lysates were obtained after 72 hours for immunoblot analysis of PTEN protein expression and phosphorylation of its downstream target kinases Akt and FAK. Representative immunoblots and quantitative data (mean ± standard error) from 4 separate blots are shown. *P < .05 relative to expression in controls.
Figure 8
Figure 8
miR-21 modulates mRNA expression of MMPs. (A) Normal human hepatocytes were transfected with miR-21 precursors or controls. Quantitative real-time PCR was performed for MMP-1, MMP-2, MMP-3, MMP-9, MMP-11, and β-actin mRNA expression. Enhanced expression of miR-21 increases MMP-9 mRNA expression in normal human hepatocytes. *P< .05 relative to control. (B) SK-HEP-1, SNU-182, and Hep-G2 cells were transfected with anti–miR-21. MMP-2, MMP-9, and MMP-11 mRNA expression was assessed by real-time PCR and normalized to expression of β-actin mRNA. The data are summarized from 3 experiments performed in quadruplicate. Inhibition of miR-21 reduced MMP-2 and MMP-9 mRNA expression in HCC cell lines compared with controls. *P < .05 relative to control.
Figure 9
Figure 9
Down-regulation of PTEN attenuates the effects of anti–miR-21 on HCC cell growth and invasion. (A) Nonmalignant human hepatocytes were transfected with control or PTEN siRNA, or control or miR-21 precursor and immunoblot analysis for PTEN, phospho-Akt Ser(P)473, phospho-FAKTyr(P)516/517, and tubulin were performed. (B) Cell migration was assessed in human hepatocytes incubated with control or PTEN miRNA. (C–F) HCC cells (5 × 10⁴/well) in 96-well plates were cotransfected with either siRNA to PTEN or control siRNA, along with 30 nmol/L anti-miR-21. (□, control anti-miRNA + control siRNA; ■, anti-miR-21 + control siRNA; grey bars, anti–miR-21 + PTEN siRNA). (C) Cell proliferation or (D) invasion was assessed after 72 hours as described in the Materials and Methods section. The mean and standard error from 4 separate experiments are shown. mRNA expression of (E) MMP-2 and (F) MMP-9 were quantitated by real-time PCR, and expressed relative to that of β-actin mRNA concurrently assessed in the same samples. (G) Cells were cotransfected with anti–mir-21 and either control or PTEN siRNA. Immunoblot analysis of PTEN, phospho-Akt Ser(P)473, and phospho-FAK Tyr(P)516/517, and tubulin was performed. Representative immunoblots are shown along with quantitative data that show the mean ± standard error from 4 separate blots. *P < .05 when compared with control siRNA-transfected cells.

References

    1. El Serag HB, Mason AC. Rising incidence of hepatocellular carcinoma in the United States. N Engl J Med. 1999;340:745–750. - PubMed
    1. Thorgeirsson SS, Grisham JW. Molecular pathogenesis of human hepatocellular carcinoma. Nat Genet. 2002;31:339–346. - PubMed
    1. Hanahan D, Weinberg RA. The hallmarks of cancer. Cell. 2000;100:57–70. - PubMed
    1. Thorgeirsson SS, Lee JS, Grisham JW. Functional genomics of hepatocellular carcinoma. Hepatology. 2006;43:S145–S150. - PubMed
    1. Calin GA, Croce CM. MicroRNA-cancer connection: the beginning of a new tale. Cancer Res. 2006;66:7390–7394. - PubMed

Publication types

MeSH terms