. 2008 Jan 27;363(1490):211-29.
doi: 10.1098/rstb.2007.2136.

Optimal moult strategies in migratory birds

Affiliations

Optimal moult strategies in migratory birds

Zoltán Barta et al. Philos Trans R Soc Lond B Biol Sci. .

Abstract

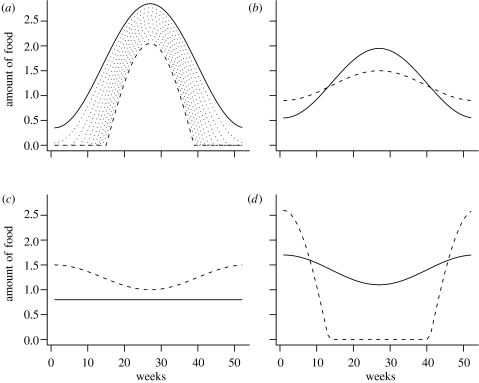
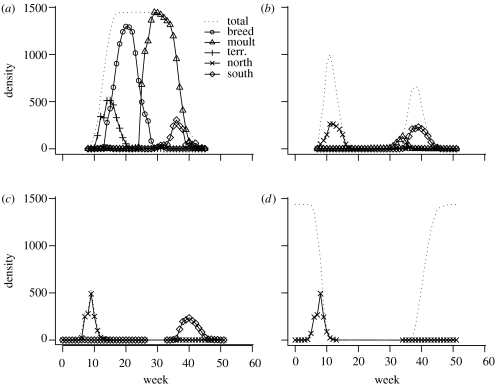
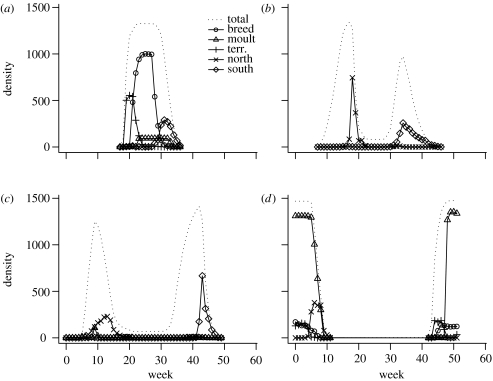
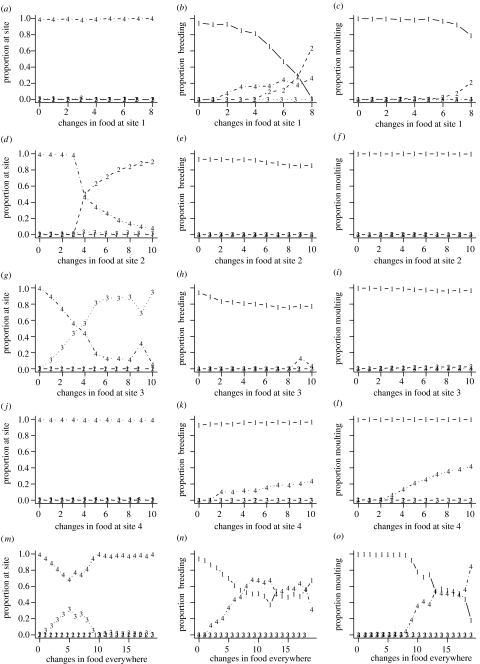
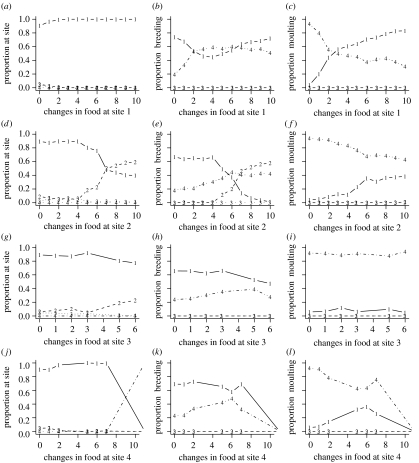
Avian migration, which involves billions of birds flying vast distances, is known to influence all aspects of avian life. Here we investigate how birds fit moult into an annual cycle determined by the need to migrate. Large variation exists in moulting patterns in relation to migration: for instance, moult can occur after breeding in the summer or after arrival in the wintering quarters. Here we use an optimal annual routine model to investigate why this variation exists. The modelled bird's decisions depend on the time of year, its energy reserves, breeding status, experience, flight feather quality and location. Our results suggest that the temporal and spatial variations in food are an important influence on a migratory bird's annual cycle. Summer moult occurs when food has a high peak on the breeding site in the summer, but it is less seasonal elsewhere. Winter moult occurs if there is a short period of high food availability in summer and a strong winter peak at different locations (i.e. the food is very seasonal but in opposite phase on these areas). This finding might explain why only long-distance migrants have a winter moult.


Figures

Figure 1
Figure 1
Temporal distribution of food on the four sites: (a) site 1; (b) site 2; (c) site 3; and (d) site 4. Solid lines, summer moult scenario; dashed lines, winter moult scenario. The dotted lines on (a) illustrate how food is changed in the food manipulation runs.
Figure 2
Figure 2
Modelled birds' behaviour during a year on the four sites: (a) site 1; (b) site 2; (c) site 3; and (d) site 4, under the summer moult scenario. The birds' breeding behaviour is not constrained (see text for details). ‘Total’, the total number of birds on the site; ‘breed’, the number of birds breeding; ‘moult’, the number of birds moulting; ‘terr.’, the number of birds searching for a territory; ‘north’, the number of birds leaving to migrate northward; ‘south’, the number of birds leaving to migrate southward.
Figure 3
Figure 3
Modelled birds' behaviour during a year on the four sites: (a) site 1; (b) site 2; (c) site 3; and (d) site 4, under the winter moult scenario. The birds' breeding behaviour is not constrained (see text for details). For detailed caption, see figure 2.
Figure 4
Figure 4
Effects of transforming the distribution of food away from the summer moult scenario towards the winter moult scenario (for details see text); breeding is unconstrained. (al) The cases where food was transformed at sites 1, 2, 3 and 4, respectively. (mo) Food was varied at all sites simultaneously. (a, d, g, j and m) The distribution of birds over the sites at week 0 (winter). (b, e, h, k and n) The proportion of birds breeding, and (c, f, i, l and o) the proportion of birds moulting over the year at the different sites. The proportion of birds is calculated as the proportion of all birds who survived the whole year. The ‘changes in food’ symbolizes the transition of food distribution from the summer moult scenario towards the winter moult scenario at a given site (as shown in figure 1a; the numbers are arbitrary labels). Number 0 is the baseline case shown in figure 2.
Figure 5
Figure 5
Effects of transforming the distribution of food away from winter moult scenario towards the summer moult scenario (for details, see text); breeding is unconstrained. (a, d, g and j) The distribution of birds over the sites at week 0 (winter). (b, e, h and k) The proportion of birds breeding and (c, f, i and l) the proportion of birds moulting over the year at the different sites. The proportion of birds is calculated as the proportion of all birds who survived the whole year. The ‘changes in food’ symbolizes the transition of food distribution from the winter moult scenario towards the summer moult scenario at a given site (as shown in figure 1a; the numbers are arbitrary labels). Number 0 is the baseline case shown in figure 2. (al) The cases where food was transformed on sites 1, 2, 3 and 4, respectively.

References

    1. Adriaensen F, Dhondt A.A. Population dynamics and partial migration of the European robin (Erithacus rubecula) in different habitats. J. Anim. Ecol. 1990;59:1077–1090. doi:10.2307/5033 - DOI
    1. Aidley D.J. Questions about migration. In: Aidley D.J, editor. Animal migration. Cambridge University Press; Cambridge, UK: 1981. pp. 1–8.
    1. Alerstam T. Cambridge University Press; Cambridge, UK: 1990. Bird migration.
    1. Alerstam T. Bird flight and optimal migration. Trends Ecol. Evol. 1991;6:210–215. doi:10.1016/0169-5347(91)90024-R - DOI - PubMed
    1. Alerstam T, Lindström A. Optimal bird migration: the relative importance of time, energy and safety. In: Gwinner E, editor. Bird migration: physiology and ecophysiology. Springer; Berlin, Germany: 1990. pp. 331–351.

Publication types

LinkOut - more resources