. 2007 Oct;27(20):7143-60.
doi: 10.1128/MCB.00253-07. Epub 2007 Aug 6.

Selective regulation of bone cell apoptosis by translational isoforms of the glucocorticoid receptor

Affiliations

Selective regulation of bone cell apoptosis by translational isoforms of the glucocorticoid receptor

Nick Z Lu et al. Mol Cell Biol. 2007 Oct.

Abstract

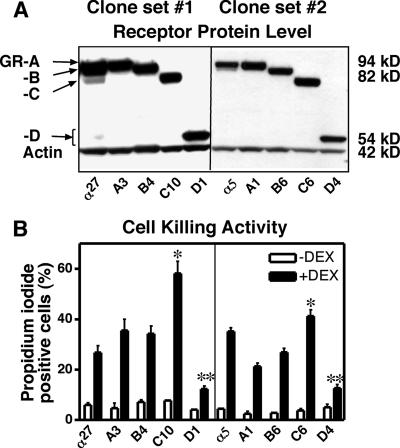
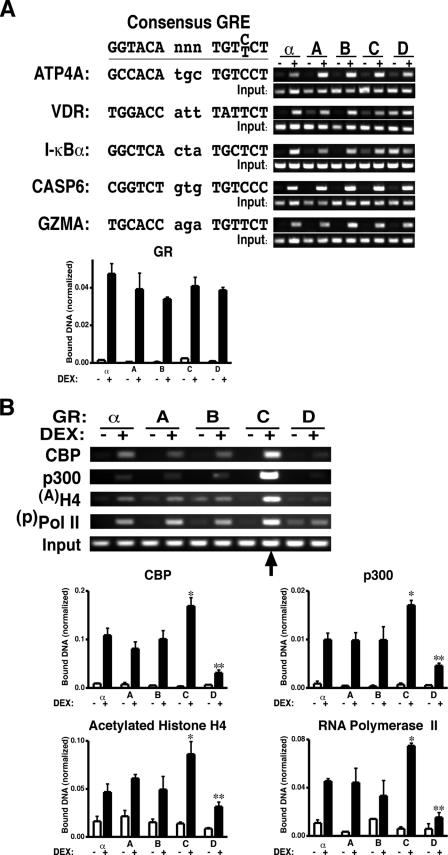
Glucocorticoids are widely used in the treatment of inflammatory and other diseases. However, high-dose or chronic administration often triggers troublesome side effects such as metabolic syndrome and osteoporosis. We recently described that one glucocorticoid receptor gene produces eight translational glucocorticoid receptor isoforms that have distinct gene-regulatory abilities. We show here that specific, but not all, glucocorticoid receptor isoforms induced apoptosis in human osteosarcoma U-2 OS bone cells. Whole human genome microarray analysis revealed that the majority of the glucocorticoid target genes were selectively regulated by specific glucocorticoid receptor isoforms. Real-time PCR experiments confirmed that proapoptotic enzymes necessary for cell death, granzyme A and caspase-6, were induced by specific glucocorticoid receptor isoforms. Chromatin immunoprecipitation assays further suggested that glucocorticoid receptor isoform-dependent induction of proapoptotic genes was likely due to selective coregulator recruitment and chromatin modification. Interestingly, the capabilities to transrepress proinflammatory genes were similar among glucocorticoid receptor isoforms. Together, these findings provide new evidence that translational glucocorticoid receptor isoforms can elicit distinct glucocorticoid responses and may be useful for the development of safe glucocorticoids with reduced side effects.


Figures

FIG. 1.
FIG. 1.
GRα induced apoptosis in U-2 OS cells. (A) Cells stably expressing hGRα were subjected to Western blot analysis. These cells express GR-A, -B, -C, and -D isoforms as indicated. (B) When treated with vehicle or DEX (100 nM) for 48 h, nucleus staining showed chromatin condensation in DEX-treated cells containing GR but not in those lacking GR. (C) Flow cytometric analysis of PI labeling showed that a higher percentage of cells expressing GR were PI positive, as indicated in the histogram highlighted with an arrow. (D) Annexin V labeling showed that GR-expressing cells, when treated with DEX, had a greater number of cells positive for cell surface annexin V and negative for PI, as indicated in the lower right quadrants on the dot plots. (E) The active PARP level was increased in GR-expressing cells as determined by Western blot analysis. (F) DNA degradation was induced in GR-expressing cells as indicated by arrows on the histogram. (G) Caspase activity was elevated in GR-expressing cells, as indicated by arrows on the histogram.
FIG. 2.
FIG. 2.
Stable expression of GR isoforms in U-2 OS cells. (A) Individual GRα isoforms were expressed at comparable levels in the absence and presence of DEX (100 nM for 2 h) as determined by Western blot analysis and ligand binding assay. Additional bands between the GR-C and -D isoforms may be nonspecific signals, and they were not consistently detected. Bmax and Kd values ± standard errors of the means (SEM) are shown. (B) The half-lives of each GR isoform were similar. The expression of each GR isoform was turned off by doxycycline. The GR protein level was determined in the absence or presence of DEX (100 nM) by Western blot analysis.
FIG. 3.
FIG. 3.
GR isoforms differentially induced apoptosis in U-2 OS cells. (A) When treated with vehicle or DEX (100 nM) for 48 h, nucleus staining showed chromatin condensation in DEX-treated cells containing GR. (B) Flow cytometric analysis of PI labeling showed that a high percentage of cells expressing the GR-C isoforms were PI positive, whereas the GR-D-expressing cells were relatively resistant to DEX killing. Time course experiments showed that GR-C isoform-expressing cells had an earlier onset of cell death than cells expressing other GR isoforms, and GR-D isoform-expressing cells had less cell death than cells expressing the other GR isoforms after 48 h of DEX treatment. (C) Annexin V labeling showed that GR-C-expressing cells, when treated with DEX, had a greater number of cells positive for cell surface annexin V and negative for PI. Similar patterns were also observed for the PARP level (D), DNA degradation (E), and caspase activation (F). Average results from five to six experiments are presented in the bar graph. One-way ANOVA was performed to compare values from DEX-treated cells expressing different GR isoforms, which was followed by Tukey post hoc analysis. *, significantly higher than that of GRα (P < 0.05); **, significantly lower than that of GRα (P < 0.05).
FIG. 4.
FIG. 4.
Characterization of two sets of U-2 OS clones. (A) The levels of GR isoforms were comparable in each set of clones. (B) GR isoform-selective killing of U-2 OS cells by DEX (100 nM, 48 h) was observed in both sets of clones. The first set of clones was extensively examined, as shown in the other figures. *, significantly higher than GRα; **, significantly lower than GRα.
FIG. 5.
FIG. 5.
Widespread and selective gene regulation by GR isoforms. (A) Clustering analysis of the 6,501 genes regulated by at least one GR isoform after 6 h of DEX treatment. The gene targets of each GR isoform are diverse and distinct. (B) Each of the GR isoforms regulated a unique set of genes. The numbers of genes induced (red) or repressed (blue) by each isoform are shown. Dotted lines mark the number of genes regulated by all isoforms. (C) Clustering analysis of 301 genes involved in cell death indicated that the majority of these genes were selectively regulated by GR isoforms. As highlighted by the brackets, GR-D isoforms did not regulate a series of genes as robustly as the other GR isoforms.
FIG. 6.
FIG. 6.
GR isoforms differentially regulated apoptotic genes. (A) Real-time PCR verification of selective regulation of apoptotic genes by GR isoforms. GZMA and CASP6 are proteases and apoptotic executor enzymes. One-way ANOVA was performed to compare values from DEX-treated cells expressing different GR isoforms, which was followed by Tukey post hoc analysis. *, significantly higher than that of GRα (P < 0.05); **, significantly lower than that of GRα (P < 0.05). (B) Cells stably expressing siRNAs against GZMA or CASP6 significantly blocked DEX-induced death as indicated by PI labeling in cells expressing the GR-C isoform. Results using two separate species of siRNAs with distinct targets (#1 and #2) are shown. One-way ANOVA was performed to compare values from DEX-treated cells expressing different siRNAs, which was followed by Tukey post hoc analysis. *, significantly lower than that of the controls (Con) (P < 0.05).
FIG. 7.
FIG. 7.
GR isoforms differentially recruit cofactors onto the GZMA promoter region (27). (A) GR isoforms, when activated by DEX, bind to several glucocorticoid response elements (GRE) equally as determined by ChIP analysis using anti-GR 57 antibody. This is true for the GZMA promoter as well. The bar graph shows the quantification of GR binding of the GZMA promoter region using real-time PCR. (B) GR-C isoforms selectively recruited cofactors, induced histone H4 acetylation, and utilized different amounts of RNA polymerase II (Pol II) as indicated by the arrow and determined by ChIP analysis using antibodies against respective cofactors, modified histones, and RNA polymerase. DNA obtained from ChIP assays was subjected to real-time PCR analysis and normalized to input. The bar graphs represent results from five to six experiments. One-way ANOVA was performed to compare values from DEX-treated cells expressing different GR isoforms, which was followed by Tukey post hoc analysis. *, significantly higher than that of GRα (P < 0.05); **, significantly lower than that of GRα (P < 0.05).
FIG. 8.
FIG. 8.
Comparison of the levels of GR isoforms in spleen and bone. All GR isoforms were found in mouse spleen and bone. The expression of the GR-D isoforms was much higher in spleen than that in bone, whereas the expression levels of the other GR isoforms were comparable between spleen and bone. Additional bands in between the GR-C and GR-D isoforms may be nonspecific signals, and they were not consistently detected.
FIG. 9.
FIG. 9.
Combination of GR isoforms. (A) Three U-2 OS cell lines were generated, where the level of the GR-A isoform is constant and the level of the second GR isoform can be regulated by addition of doxycycline. (B) The constitutively expressed GR-A isoform is responsible for 20 to 30% of cell death (0.3 ng/ml doxycycline). Increases in the amount of the GR-A (control) or the GR-C isoform induced additional cell death as measured by PI staining, whereas increases in the amount of the GR-D isoform did not.
FIG. 10.
FIG. 10.
Transrepression activity of GR isoforms. (A) All GR isoforms dose-dependently downregulated NF-κB reporter gene expression. (B) All GR isoforms inhibited LPS-induced expression of TNF, IL-8, and granulocyte-monocyte colony-stimulating factor (GMCSF) in U-2 OS cells. One-way ANOVA was performed to compare values from different treatments, which was followed by Tukey post hoc analysis. y-axis values are percentages. *, significantly different from that of LPS treatment (P < 0.05).

Similar articles

Cited by

References

    1. Albiston, A. L., V. R. Obeyesekere, R. E. Smith, and Z. S. Krozowski. 1994. Cloning and tissue distribution of the human 11 beta-hydroxysteroid dehydrogenase type 2 enzyme. Mol. Cell. Endocrinol. 105:R11-R17. - PubMed
    1. Ashburner, M., C. A. Ball, J. A. Blake, D. Botstein, H. Butler, J. M. Cherry, A. P. Davis, K. Dolinski, S. S. Dwight, J. T. Eppig, M. A. Harris, D. P. Hill, L. Issel-Tarver, A. Kasarskis, S. Lewis, J. C. Matese, J. E. Richardson, M. Ringwald, G. M. Rubin, and G. Sherlock. 2000. Gene ontology: tool for the unification of biology. Nat. Genet. 25:25-29. - PMC - PubMed
    1. Bronnegard, M. 1996. Steroid receptor number. Individual variation and downregulation by treatment. Am. J. Respir. Crit. Care Med. 154:S28-S32, S32-S33. - PubMed
    1. Chrysis, D., F. Zaman, A. S. Chagin, M. Takigawa, and L. Savendahl. 2005. Dexamethasone induces apoptosis in proliferative chondrocytes through activation of caspases and suppression of the Akt-phosphatidylinositol 3′-kinase signaling pathway. Endocrinology 146:1391-1397. - PubMed
    1. Chua, C. C., B. H. Chua, Z. Chen, C. Landy, and R. C. Hamdy. 2003. Dexamethasone induces caspase activation in murine osteoblastic MC3T3-E1 cells. Biochim. Biophys. Acta 1642:79-85. - PubMed

Publication types

MeSH terms