. 2007 Aug;5(8):e222.
doi: 10.1371/journal.pbio.0050222.

The circadian clock regulates auxin signaling and responses in Arabidopsis

Affiliations

The circadian clock regulates auxin signaling and responses in Arabidopsis

Michael F Covington et al. PLoS Biol. 2007 Aug.

Abstract

The circadian clock plays a pervasive role in the temporal regulation of plant physiology, environmental responsiveness, and development. In contrast, the phytohormone auxin plays a similarly far-reaching role in the spatial regulation of plant growth and development. Went and Thimann noted 70 years ago that plant sensitivity to auxin varied according to the time of day, an observation that they could not explain. Here we present work that explains this puzzle, demonstrating that the circadian clock regulates auxin signal transduction. Using genome-wide transcriptional profiling, we found many auxin-induced genes are under clock regulation. We verified that endogenous auxin signaling is clock regulated with a luciferase-based assay. Exogenous auxin has only modest effects on the plant clock, but the clock controls plant sensitivity to applied auxin. Notably, we found both transcriptional and growth responses to exogenous auxin are gated by the clock. Thus the circadian clock regulates some, and perhaps all, auxin responses. Consequently, many aspects of plant physiology not previously thought to be under circadian control may show time-of-day-specific sensitivity, with likely important consequences for plant growth and environmental responses.


Figures
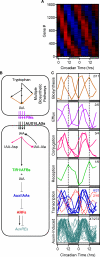
Figure 1
Figure 1. Many Genes in the Auxin-Signaling Pathway Are Circadian Regulated
(A) Heatmap representation [74] of 1,610 circadian-regulated genes shows peak expression occurs at all phases. High expression is depicted in red and low expression in blue. (B) Schematic of the auxin-signaling pathway is presented (see Table S3 for the names of genes whose profiles are shown here) [31,34,37,39,42,43]. IAA is synthesized via tryptophan-independent (not shown) and multiple tryptophan-dependent pathways; two enzymes implicated in the final steps of the indole-3-acetaldoxime and indole-3-acetamide biosynthetic pathways are encoded by circadian-regulated genes. IAA, which undergoes polar transport throughout the plant, can be temporarily or permanently inactivated by conjugation to amino acids. Free IAA binds to the TIR1/AFB F-box proteins and facilitates their interaction with Aux/IAA proteins that are subsequently targeted for degradation. Therefore, in the presence of auxin, Aux/IAA proteins no longer prevent the ARF transcription factors from modulating expression of auxin-regulated genes. Steps with clock-regulated gene expression are color coded to match expression data in (C). (C) Normalized microarray expression data for circadian-regulated auxin-signaling [31,34,37,39,42,43] and auxin-induced [36] genes are shown. Genes have been grouped and color coded according to general function or class (see [B]). The fraction of circadian-regulated genes is indicated for each group (see also Tables S2 and S3). A total of 57% of auxin-induced genes show peak expression during a 4-h window in the middle of the subjective day, compared to 22% for all circadian-regulated genes. This ratio increases to 86% for genes highly induced by auxin (≥6-fold).
Figure 2
Figure 2. Correlation between Auxin-Responsiveness and Circadian Regulation
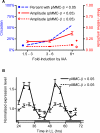
(A) Relationship between degree of induction by auxin [36] and circadian regulation is presented. Genes were classified on the basis of responsiveness to auxin (x-axis), and the percent with clock-regulated gene expression (pMMC-β < 0.05) was plotted in blue on left y-axis; we found a significant correlation between fold induction and percent rhythmicity (χ2 test: p = 2.3 × 10−06). A closed blue circle (left) represents the percent of all expressed nuclear-encoded genes that are circadian regulated. There is a strong correlation between fold induction by IAA and relative amplitude of circadian-regulated genes (pMMC-β < 0.05) and a weak correlation for noncircadian genes (1 > pMMC-β ≥ 0.05), plotted in red on the right y-axis (circadian/IAA: r s = 0.680, p = 4.1 × 10−07; noncircadian/IAA: r s = 0.182, p = 1.4 × 10−02). Indeed, there are significant differences in relative amplitude of circadian genes between highly IAA-induced and other IAA-induced genes (t-tests: (6+) versus (3 − 6), p = 7.9 × 10−04; (6+) versus (1.5 − 3), p = 2.2 × 10−04). Discrete data points on the right represent the mean relative amplitude of all expressed nuclear-encoded genes that are circadian regulated (closed red diamond) and noncircadian (open red diamond). (B) Mean normalized microarray expression data for highly auxin-induced genes are presented [36]. Genes induced by auxin >6-fold have been classified as circadian regulated (pMMC-β < 0.05 and 19 ≤ period ≤ 29 h) or not (pMMC-β > 0.05 and/or period ≤ 19 or ≥ 29 h). Error bars represent the standard error of the mean.
Figure 3
Figure 3. Auxin Affects Rhythmic Expression of Clock Genes in a Dose-Dependent Manner
Average luciferase activity of CCA1::LUC (A, C, E) and TOC1::LUC (B, D, F) plants (n = 9–12) with standard error of the mean in response to exogenous auxin is presented. Seedlings were sprayed with the indicated concentrations of IAA after 44 h in continuous light (red tick mark) (A) and (B), or 1–2 h prior to the start of imaging, were transferred to growth medium containing the indicated concentrations of IAA (C) and (D) or 2,4-D (E) and (F). See Table S5 for statistical analyses. Plants were entrained for 6 d in 12-h white light/12-h dark photoperiods before being imaged in constant red light. (C) and (D) and (E) and (F) show representative data from three and two independent experiments, respectively.
Figure 4
Figure 4. Native Auxin Signaling and Sensitivity to Exogenous Auxin Are Circadian Regulated
(A) eDR5::LUC bioluminescence with standard error of the mean is shown for T1 plants in continuous light (black trace with error bars; n = 28; circadian and expression ≥5% above background). Data are also shown for eDR5::LUC T1 plants that were sprayed with 20 μM IAA at ZT47 (purple line), ZT55 (green line), and ZT65 (dark red line) (n = 32, 34, and 34; expression ≥5% above background prior to treatment). The y-axis has been split in order to better visualize both the circadian and the auxin-responsive expression of eDR5::LUC. (B) eDR5::LUC rhythms in the presence of exogenous auxins (IAA and 2,4-D) and an auxin transport inhibitor (NPA) are shown. Bioluminescence from the apex of each seedling was measured (n = 3–18). (C) Circadian gating of auxin sensitivity is presented. Groups of eDR5::LUC plants (n = 8) were treated with 0.15 μM IAA at 4-h intervals. Bioluminescence levels at 1 h prior to treatment and 1, 3, and 5 h after treatment are shown in various colors for each auxin application. Data from treated samples have been normalized such that the bioluminescence level of the pretreatment time point matches that of the control, shown in black (i.e., all values for a particular treatment have been divided by the pretreatment value and multiplied by the control value that corresponds to the pretreatment time point). The color-coded tick marks above the x-axis correspond to the times of auxin application data in Figure 4D. Areas shaded light- and dark-gray correspond to the 6-h periods in Figure 5A during which exogenous auxin promotes or has no effect, respectively, on hypocotyl elongation. (See Figure S5 for an alternate presentation of the data from Figure 4C, see Figure S6 for this data plotted adjacent to the data from Figure 5A.) (D) eDR5::LUC plants were sprayed with the indicated concentrations of IAA at different times of day as described for (C). Presented are the differences in bioluminescence 3 h after IAA treatment compared to the control plants. The lower range of doses is also shown as an inlay. One or two asterisks indicate that the response at ZT44 is significantly (p < 0.05) greater than the responses at one or both of the other time points, respectively. Datasets are color coded to match the tick marks above the x-axis in Figure 4C. (A–C) and (D) show representative data from two and three independent experiments each, respectively.
Figure 5
Figure 5. Auxin-Induced Hypocotyl Elongation Is Gated by the Circadian Clock
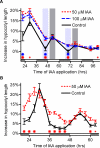
Hypocotyl elongation of free-running plants in response to auxin treatment was monitored twice a day for 4 d (A) or at 3-h intervals over 2 d (B). Plants were entrained for 3 d in 12-h white-light/12-h dark photoperiods and then transferred to constant red light. The time of auxin or mock treatment is graphed on the x-axis and the percent increase in hypocotyl length observed over the subsequent 6 h is indicated on the y-axis. Data points are plotted in the middle of each 6-h treatment. Asterisks on the x-axis indicate time points at which hypocotyl elongation of auxin-treated seedlings was significantly greater than in the controls (t-tests: small asterisk if p < 0.05, large asterisk if p < 0.01). (A) Areas shaded light- and dark-gray correspond to the 6-hr periods during which exogenous auxin promotes or has no effect, respectively, on hypocotyl elongation. (A) Shows representative data from two independent experiments. (See Figure S6 for a direct comparison of Figures 4C and [A]).

Comment in

References

    1. Johnson CH, Kyriacou CP. Clock evolution and adaptation: Whence and whither? In: Hall AJW, McWatters HG, editors. Endogenous plant rhythms. Ames (Iowa): Blackwell Synergy; 2005. pp. 237–260.
    1. Woelfle MA, Ouyang Y, Phanvijhitsiri K, Johnson CH. The adaptive value of circadian clocks: An experimental assessment in cyanobacteria. Curr Biol. 2004;14:1481–1486. - PubMed
    1. Dodd AN, Salathia N, Hall A, Kevei E, Toth R, et al. Plant circadian clocks increase photosynthesis, growth, survival, and competitive advantage. Science. 2005;309:630–633. - PubMed
    1. Salome PA, McClung CR. The Arabidopsis thaliana clock. J Biol Rhythms. 2004;19:425–435. - PubMed
    1. Fowler S, Lee K, Onouchi H, Samach A, Richardson K, et al. GIGANTEA: A circadian clock-controlled gene that regulates photoperiodic flowering in Arabidopsis and encodes a protein with several possible membrane-spanning domains. Embo J. 1999;18:4679–4688. - PMC - PubMed

Publication types

MeSH terms

Substances

Associated data