. 2007;8(8):R157.
doi: 10.1186/gb-2007-8-8-r157.

An immune response gene expression module identifies a good prognosis subtype in estrogen receptor negative breast cancer

Affiliations

An immune response gene expression module identifies a good prognosis subtype in estrogen receptor negative breast cancer

Andrew E Teschendorff et al. Genome Biol. 2007.

Abstract

Background: Estrogen receptor (ER)-negative breast cancer specimens are predominantly of high grade, have frequent p53 mutations, and are broadly divided into HER2-positive and basal subtypes. Although ER-negative disease has overall worse prognosis than does ER-positive breast cancer, not all ER-negative breast cancer patients have poor clinical outcome. Reliable identification of ER-negative tumors that have a good prognosis is not yet possible.

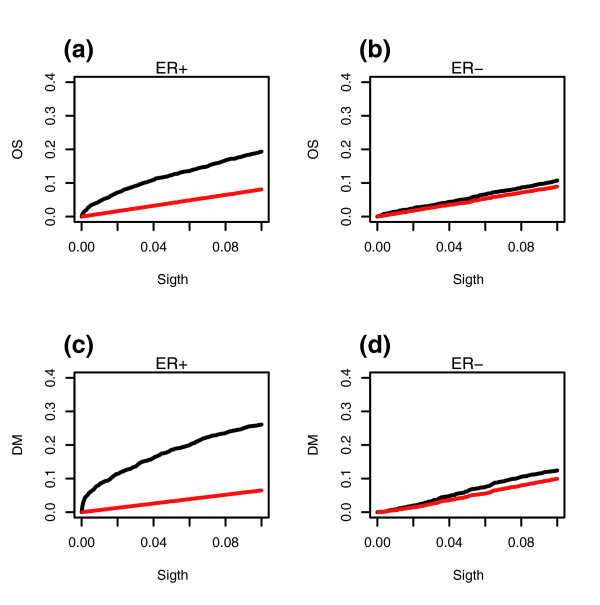
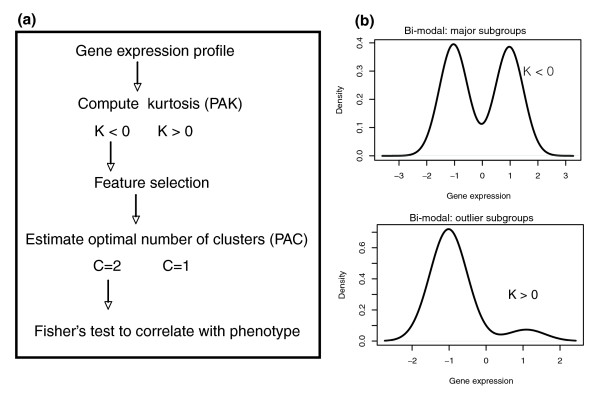
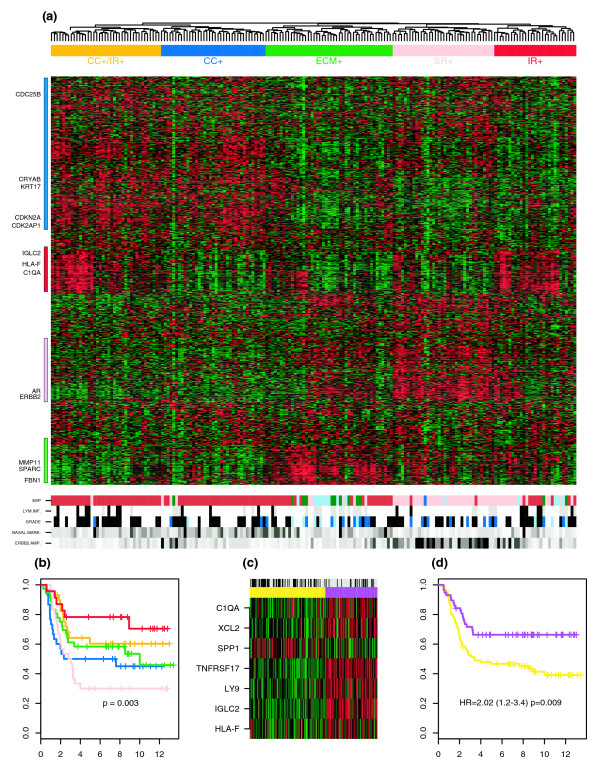
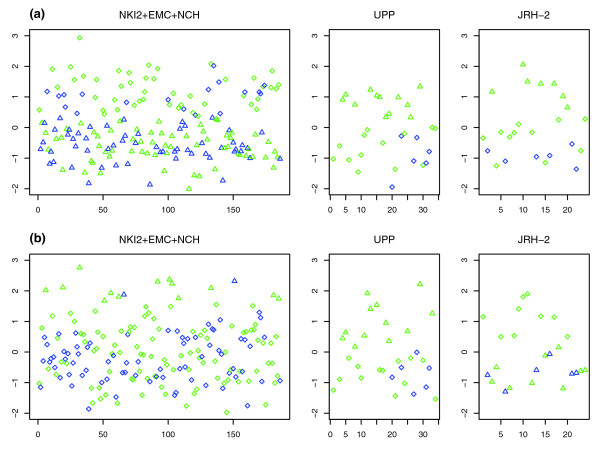
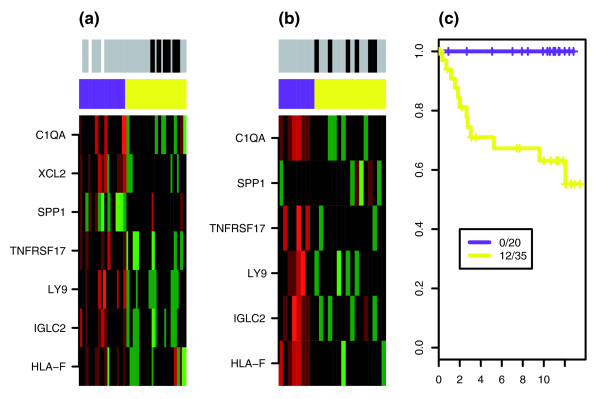
Results: We apply a recently proposed feature selection method in an integrative analysis of three major microarray expression datasets to identify molecular subclasses and prognostic markers in ER-negative breast cancer. We find a subclass of basal tumors, characterized by over-expression of immune response genes, which has a better prognosis than the rest of ER-negative breast cancers. Moreover, we show that, in contrast to ER-positive tumours, the majority of prognostic markers in ER-negative breast cancer are over-expressed in the good prognosis group and are associated with activation of complement and immune response pathways. Specifically, we identify an immune response related seven-gene module and show that downregulation of this module confers greater risk for distant metastasis (hazard ratio 2.02, 95% confidence interval 1.2-3.4; P = 0.009), independent of lymph node status and lymphocytic infiltration. Furthermore, we validate the immune response module using two additional independent datasets.

Conclusion: We show that ER-negative basal breast cancer is a heterogeneous disease with at least four main subtypes. Furthermore, we show that the heterogeneity in clinical outcome of ER-negative breast cancer is related to the variability in expression levels of complement and immune response pathway genes, independent of lymphocytic infiltration.


Figures

Figure 1
Figure 1
FDR comparison in ER- and ER+ breast cancer. For various significance thresholds (sigth), we plot the fraction of observed genes with P values less than the significance threshold (black) as well as the corresponding fraction of false positives, as estimated using a q value analysis (red). (a) Overall survival for ER+ breast cancer. (b) Overall survival for ER- breast cancer. (c) Time to distant metastasis for ER+ breast cancer. (d) Time to distant metastasis for ER- breast cancer. P values were obtained from the log-rank test using Cox regression models. ER, estrogen receptor; FDR, false discovery rate.
Figure 2
Figure 2
PACK flowchart. (a) A schematic diagram of PACK, as used in this study. For each gene expression profile an unbiased estimate of its kurtosis, K, is computed. Genes with negative kurtosis are selected because only these define large subgroups (of sizes >22% of the total sample size). Further unsupervised clustering may then be performed on this subset of negative kurtosis profiles to find novel tumor subclasses. Alternatively, to find robust prognostic markers, negative kurtosis profiles are filtered further based on whether there is evidence of bimodality (C = 2). This step requires a cluster inference algorithm and a model selection criterion to discard those profiles that are best described by a single gaussian (C = 1; by random chance gaussian profiles may have negative kurtosis). Correlation to phenotypes (here phenotypes) is done with Fisher's test to evaluate whether the distribution of the categorical phenotype across the two clusters is significantly different from random. (b) Density curves of typical bimodal negative and positive kurtosis gene expression profiles. X-axis shows gene expression on a log2 scale. PACK, Profile Analysis using Clustering and Kurtosis.
Figure 3
Figure 3
Molecular subclasses in ER- breast cancer. (a) Complete linkage hierarchical clustering of 186 ER- breast tumors over 813 genes with negative kurtosis profiles. Five sample clusters were identified and characterized in terms of the patterns of over-expression and under-expression of four gene clusters related to cell cycle (CC; blue), immune response (IR; red), extracellular matrix (ECM; green), and steroid hormone response (SR; pink) functions. Panels show the distribution of the SSP subtype [23], the lymphocytic infiltration score, histologic grade, basal marker [27], and ERBB2+ amplifier subtype. Panel color codes: SSP (pink = HER2, brown = basal, dark green = normal, sky blue = luminal A, and blue = luminal B); LYM.INF (black = high, gray = low, and white = missing); GRADE (black = high, blue = intermediate, sky blue = low, and white = missing), BASAL.MARK. (black = high and white = low), ERBB2-AMP (black = high and white = low). The BASAL.MARK. profile represents an average over validated basal markers in [27], whereas the ERBB2-AMP profile was calculated as an average over three genes in the ERBB2 amplicon (ERBB2, STARD3, GRB7). (b) Kaplan-Meier curves for time to distant metastasis (years) and for the five subclasses identified in panel (a). (c) Partitioning around medoids clustering over the seven-gene prognostic immune response module. Panel color codes: purple = cluster over-expressing module, yellow = cluster under-expressing module, black = poor outcome samples, gray = good outcome samples, green = relative under-expression, and red = relative over-expression. (d) Kaplan-Meier curves for time to distant metastasis for the two groups identified in panel (c). Hazard ratio, 95% confidence interval, and log-rank test P values are shown. ER, estrogen receptor; SSP, single sample predictor.
Figure 4
Figure 4
Expression profiles of selected prognostic markers in ER- breast cancer. Expression profile (on a log2 scale) of selected prognostic markers (a) IGLC2 and (b) C1QA in the integrated cohort of 186 ER- tumours (NKI2 + EMC + NCH), and in the validation cohorts UPP and JRH-2. Good outcome samples are shown in green, and poor outcome samples in blue. Clusters were inferred using the variational Bayesian approach in NKI2 + EMC + NCH and the pam algorithm in the UPP and JRH-2 cohorts. Infered clusters are indicated by different shapes (triangles and diamonds). ER, estrogen receptor; pam, partitioning around medoids.
Figure 5
Figure 5
Pam clustering over IR module in external ER- cohorts. Heatmap of gene expression of seven-gene IR-module in ER- samples of the (a) UPP and (b) JRH-2 cohorts. Shown are the clusters over-expressing (purple) and under-expressing (yellow) the IR module, as predicted by the pam algorithm. Good outcome samples are shown in gray, and poor outcome samples in black. Green indicates relative under-expression, and red indicates relative over-expression. (c) Kaplan-Meier survival curves over combined external cohorts (for UPP end-point was disease-specific survival, and for JRH-2 it was recurrence-free survival), with the number of events and samples in each of the two predicted groups. ER, estrogen receptor; pam, partitioning around medoids.

References

    1. Brenton JD, Carey LA, Ahmed AA, Caldas C. Molecular classification and molecular forecasting of breast cancer: ready for clinical application? J Clin Oncol. 2005;23:7350–7360. doi: 10.1200/JCO.2005.03.3845. - DOI - PubMed
    1. Rakha EA, El-Sayed ME, Green AR, Paish EC, Lee AH, Ellis IO. Breast carcinoma with basal differentiation: a proposal for pathology definition based on basal cytokeratin expression. Histopathology. 2007;50:434–438. doi: 10.1111/j.1365-2559.2007.02638.x. - DOI - PubMed
    1. van 't Veer LJ, Dai H, van de Vijver MJ, He YD, Hart AA, Mao M, Peterse HL, van der Kooy K, Marton MJ, Witteveen AT, et al. Gene expression profiling predicts clinical outcome of breast cancer. Nature. 2002;415:530–536. doi: 10.1038/415530a. - DOI - PubMed
    1. Paik S, Shak S, Tang G, Kim C, Baker J, Cronin M, Baehner FL, Walker MG, Watson D, Park T, et al. A multigene assay to predict recurrence of tamoxifen-treated, node-negative breast cancer. N Engl J Med. 2004;351:2817–2826. doi: 10.1056/NEJMoa041588. - DOI - PubMed
    1. Wang Y, Klijn JG, Zhang Y, Sieuwerts AM, Look MP, Yang F, Talantov D, Timmermans M, Meijer-van Gelder ME, Yu J, et al. Gene-expression profiles to predict distant metastasis of lymph-node-negative primary breast cancer. Lancet. 2005;365:671–679. - PubMed

Publication types