

Comparative transcriptome analysis of embryonic and adult stem cells with extended and limited differentiation capacity
- PMID: 17683608
- PMCID: PMC2374994
- DOI: 10.1186/gb-2007-8-8-r163
Comparative transcriptome analysis of embryonic and adult stem cells with extended and limited differentiation capacity
Abstract
Background: Recently, several populations of postnatal stem cells, such as multipotent adult progenitor cells (MAPCs), have been described that have broader differentiation ability than classical adult stem cells. Here we compare the transcriptome of pluripotent embryonic stem cells (ESCs), MAPCs, and lineage-restricted mesenchymal stem cells (MSCs) to determine their relationship.
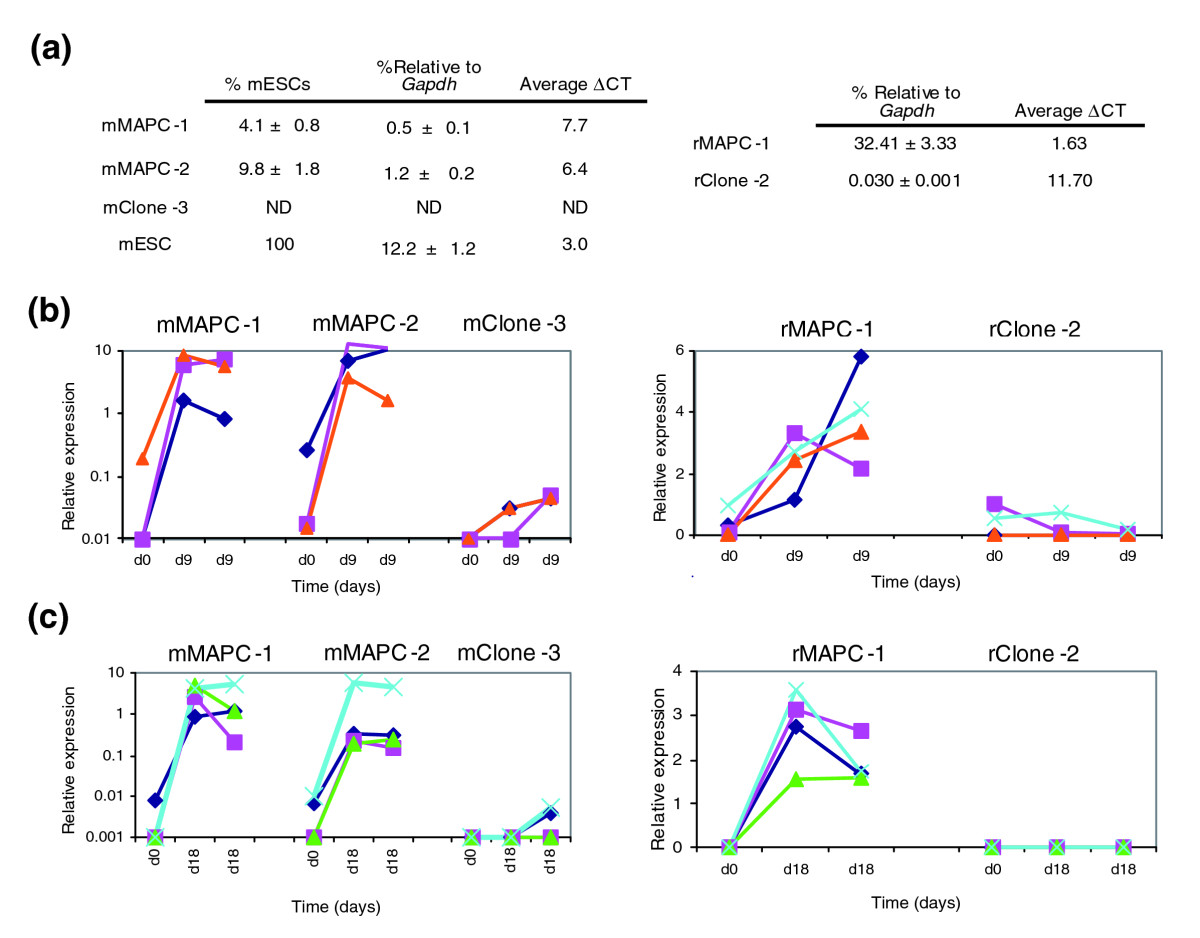
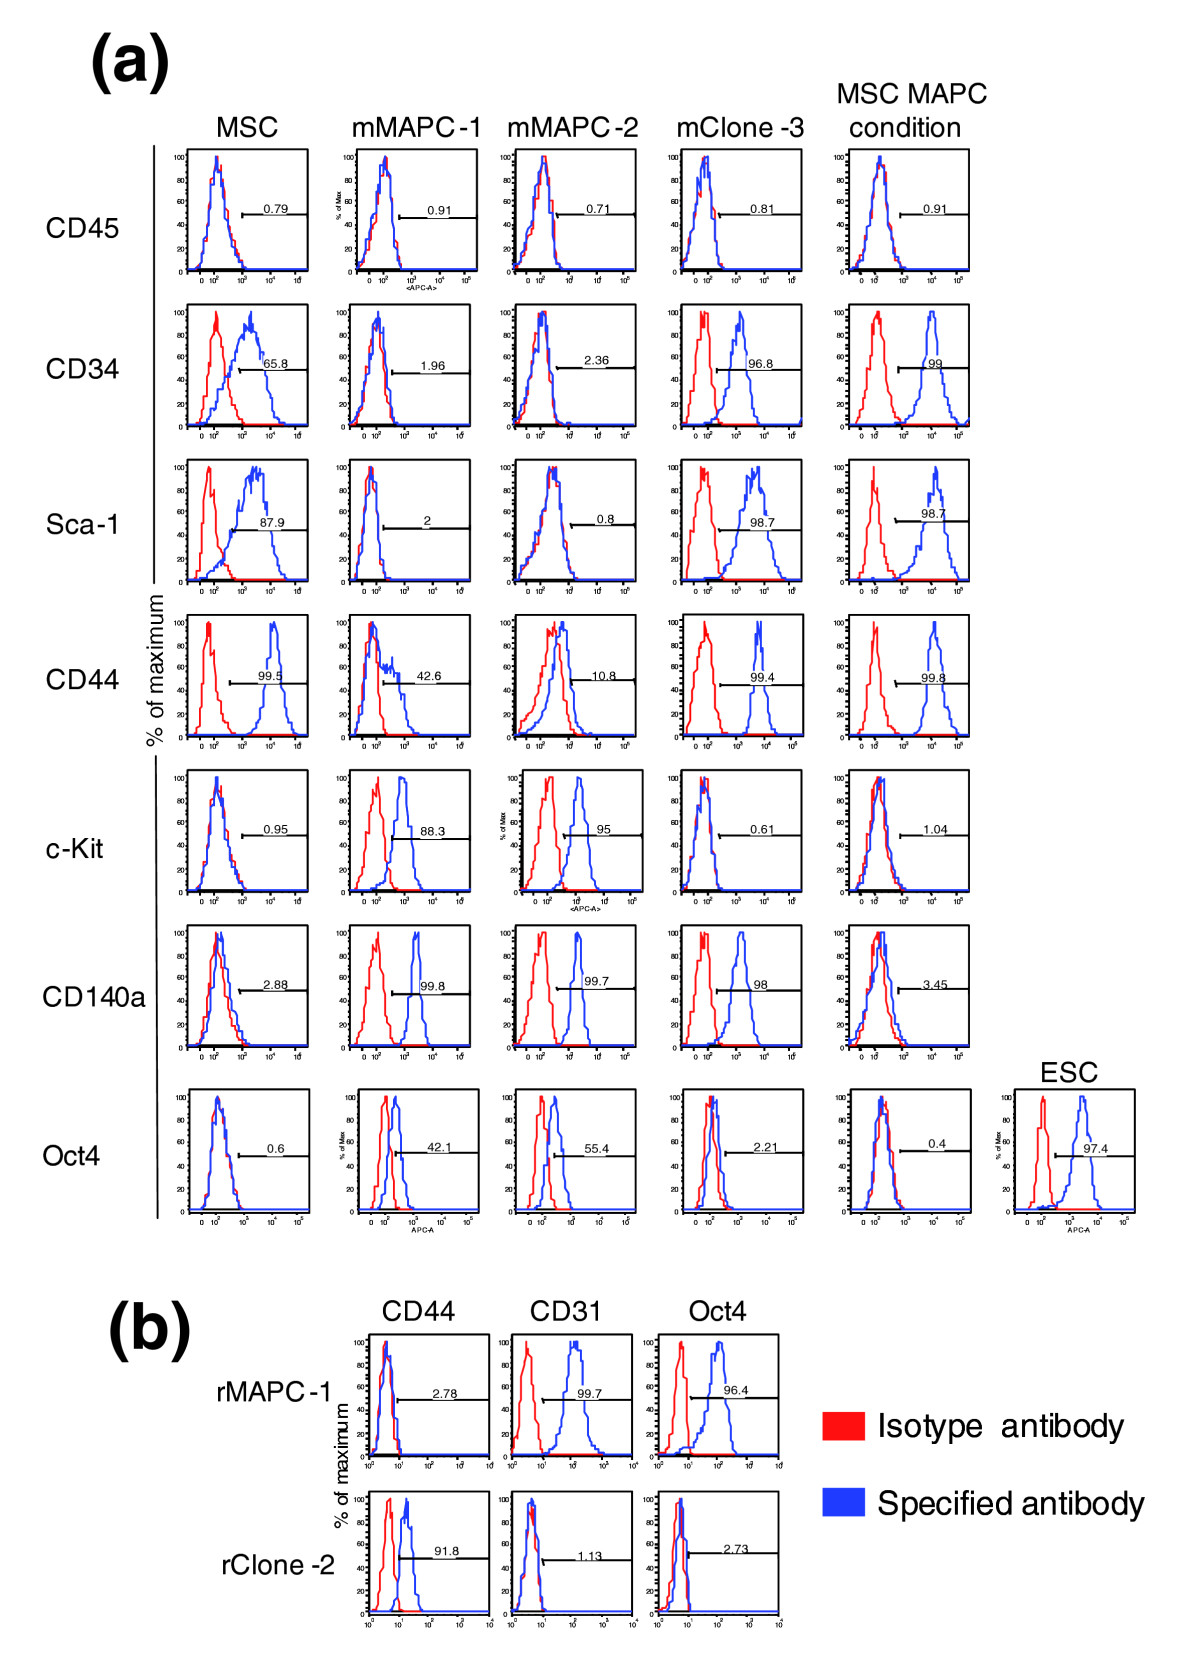
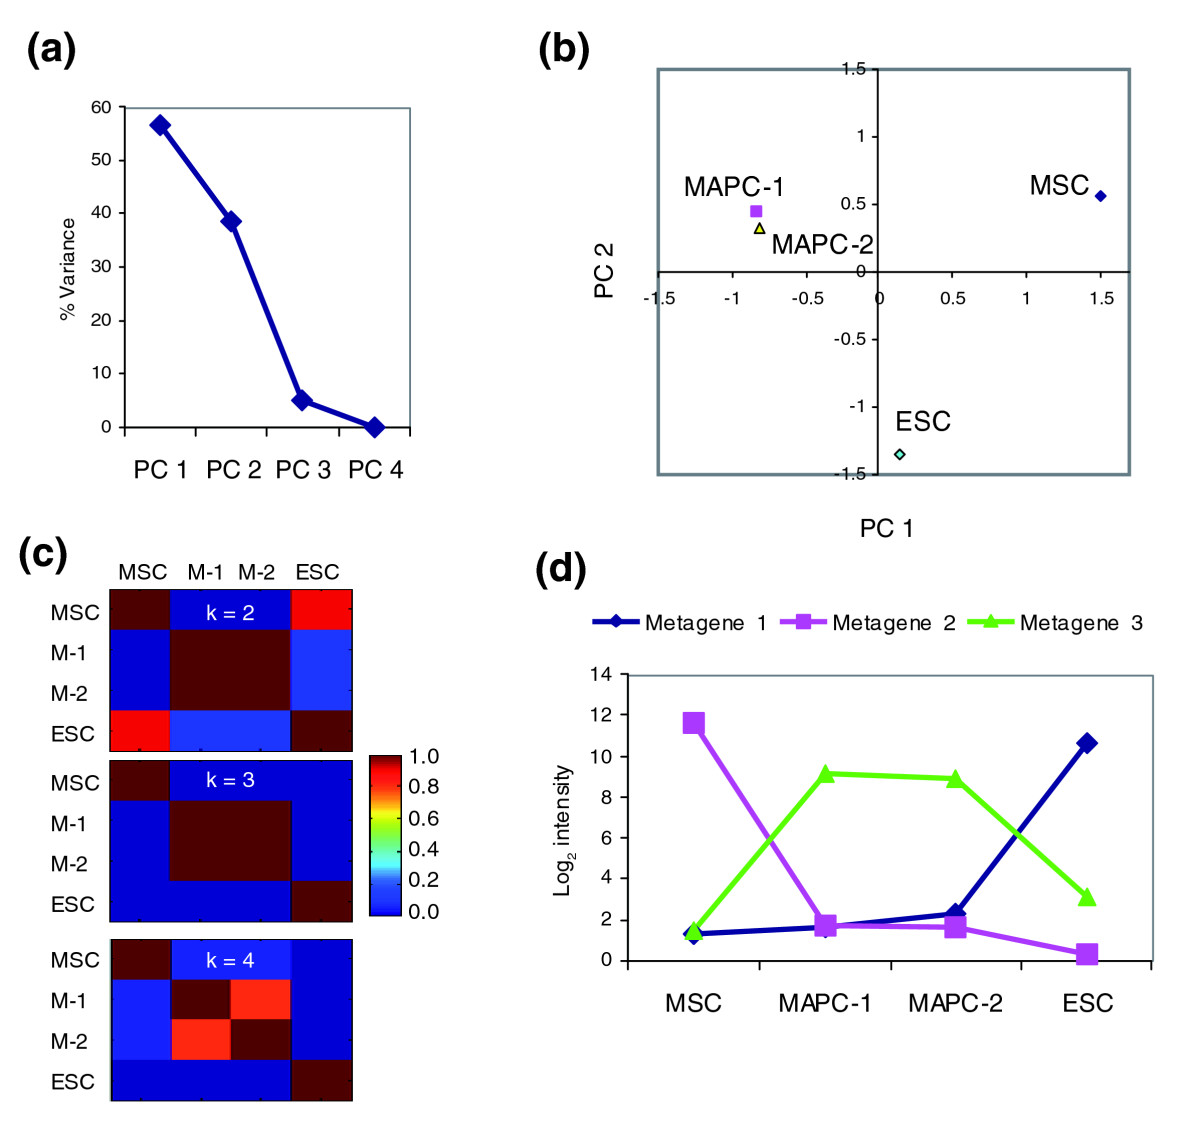
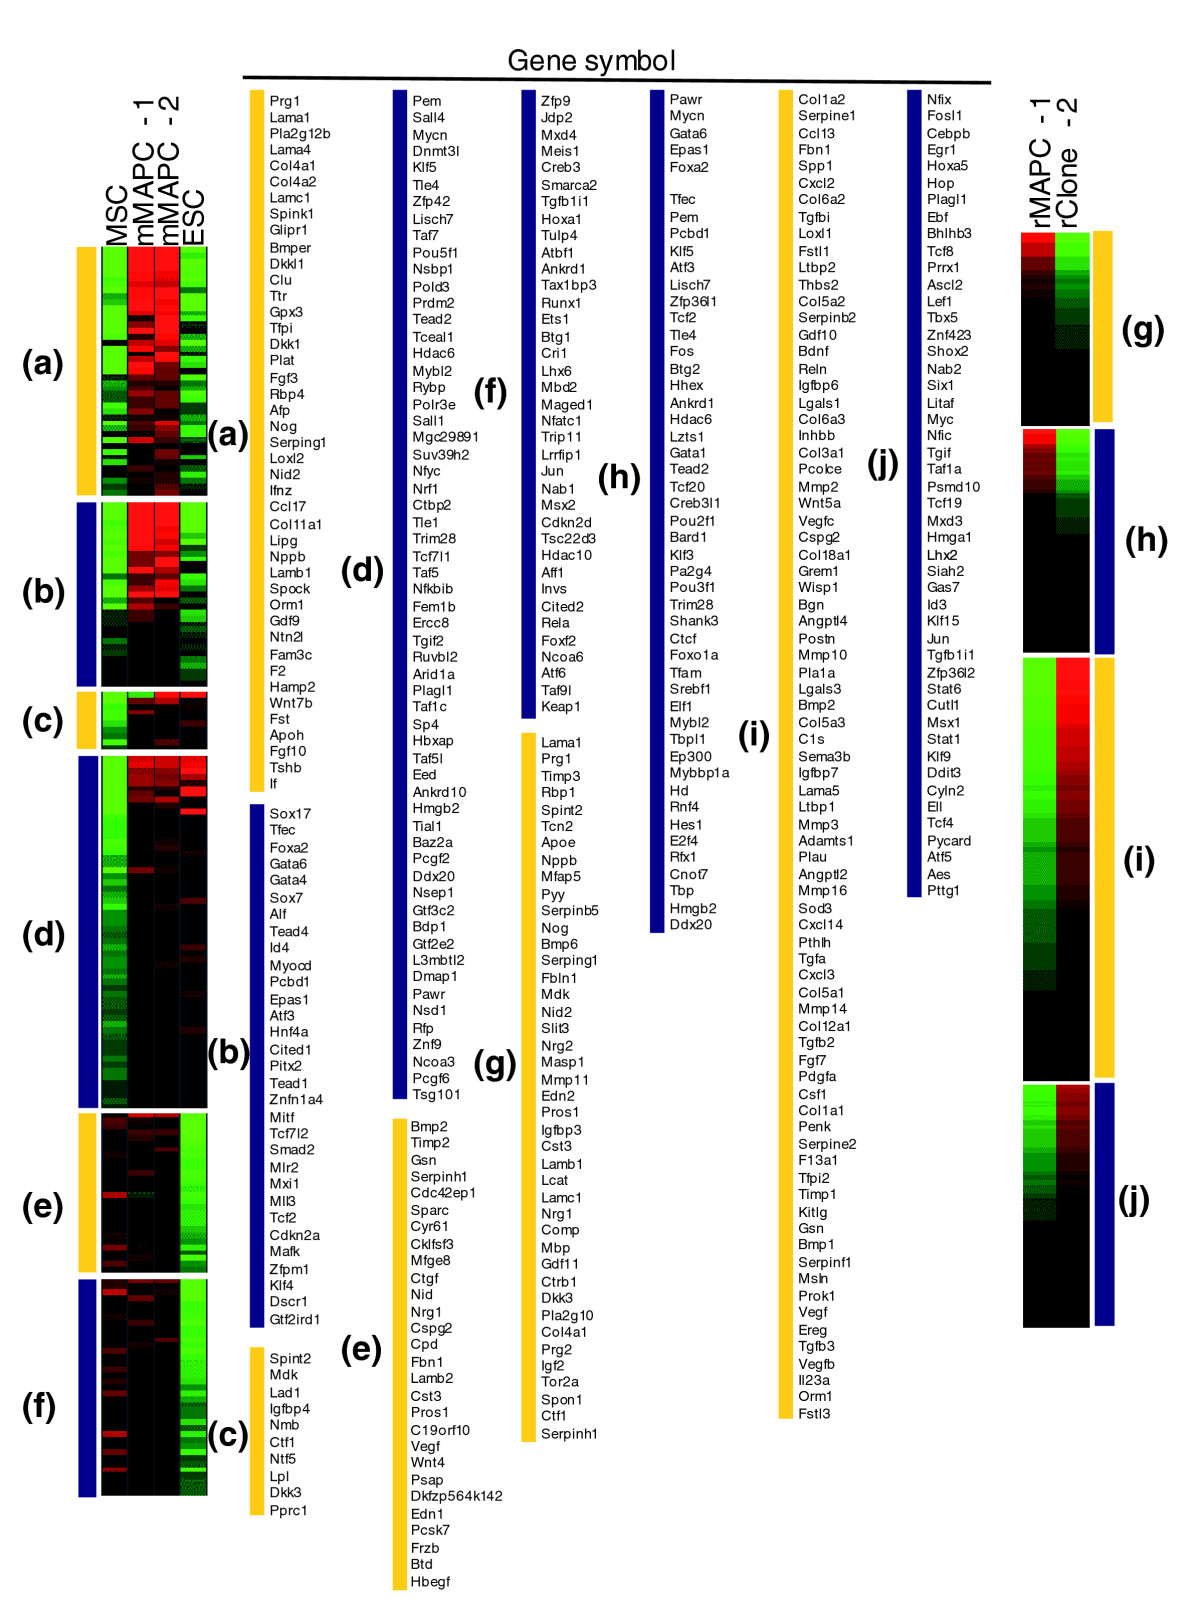
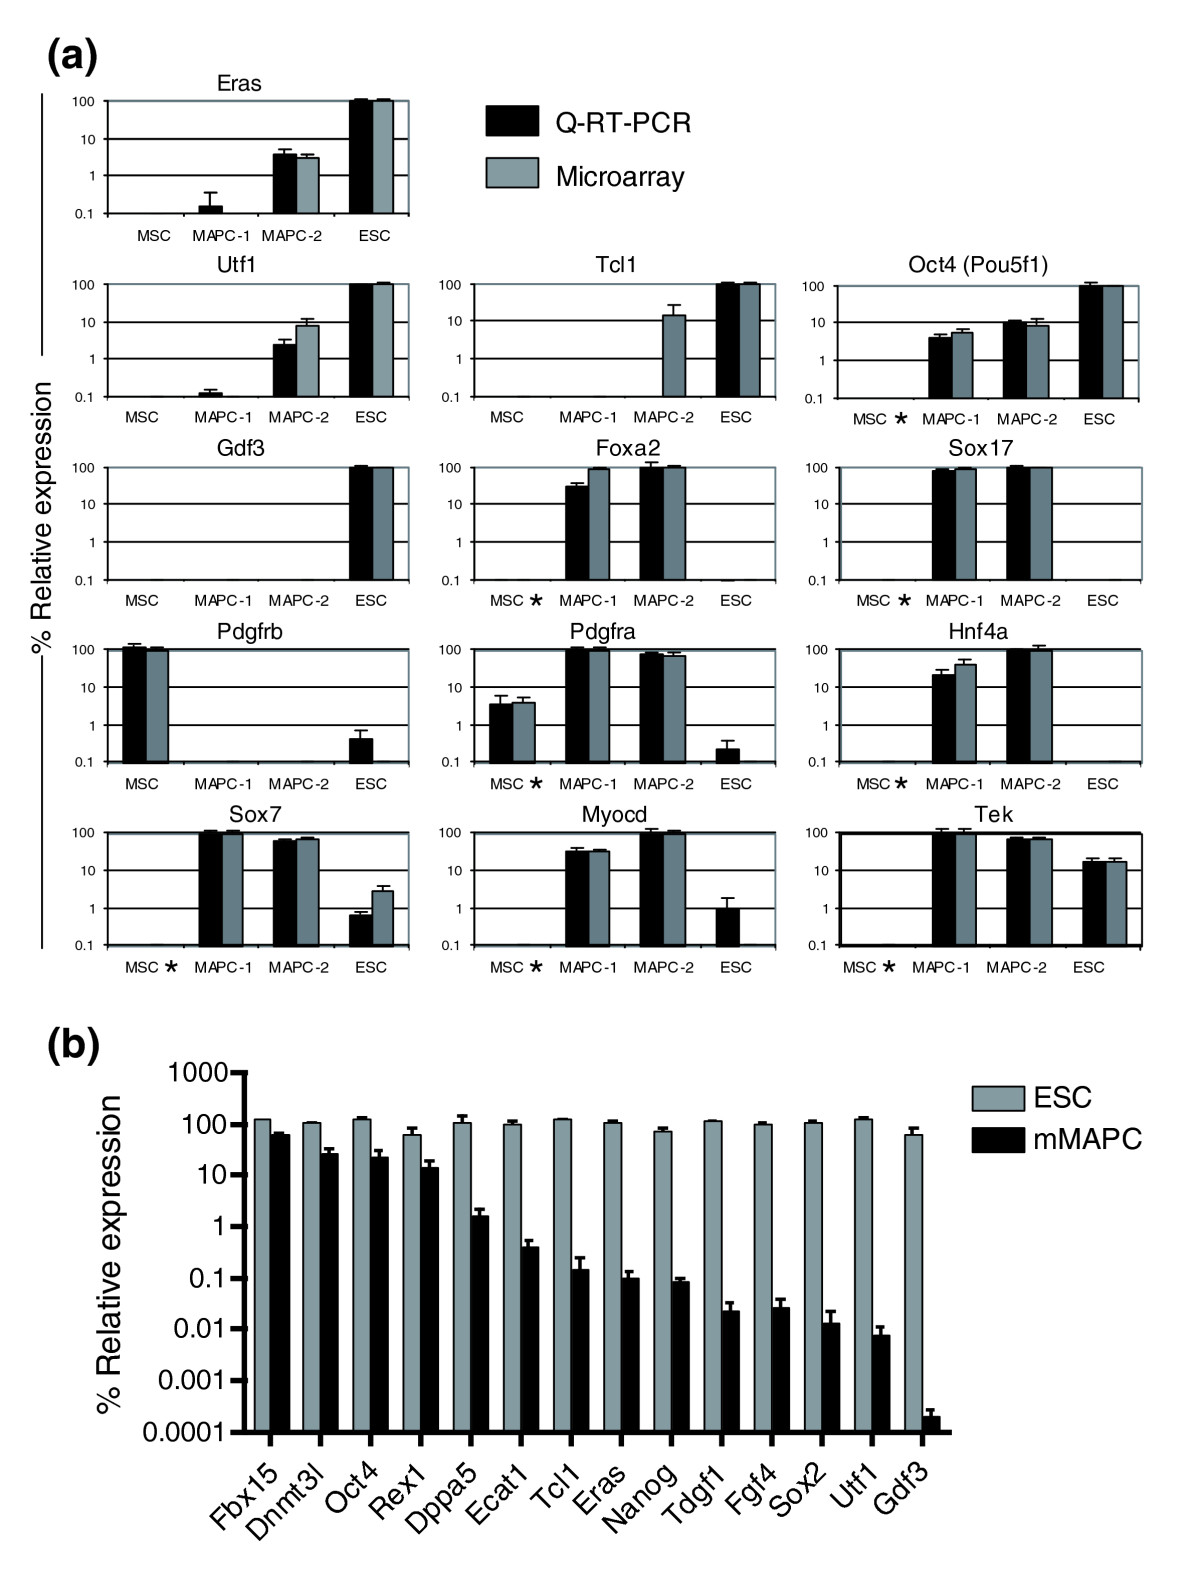
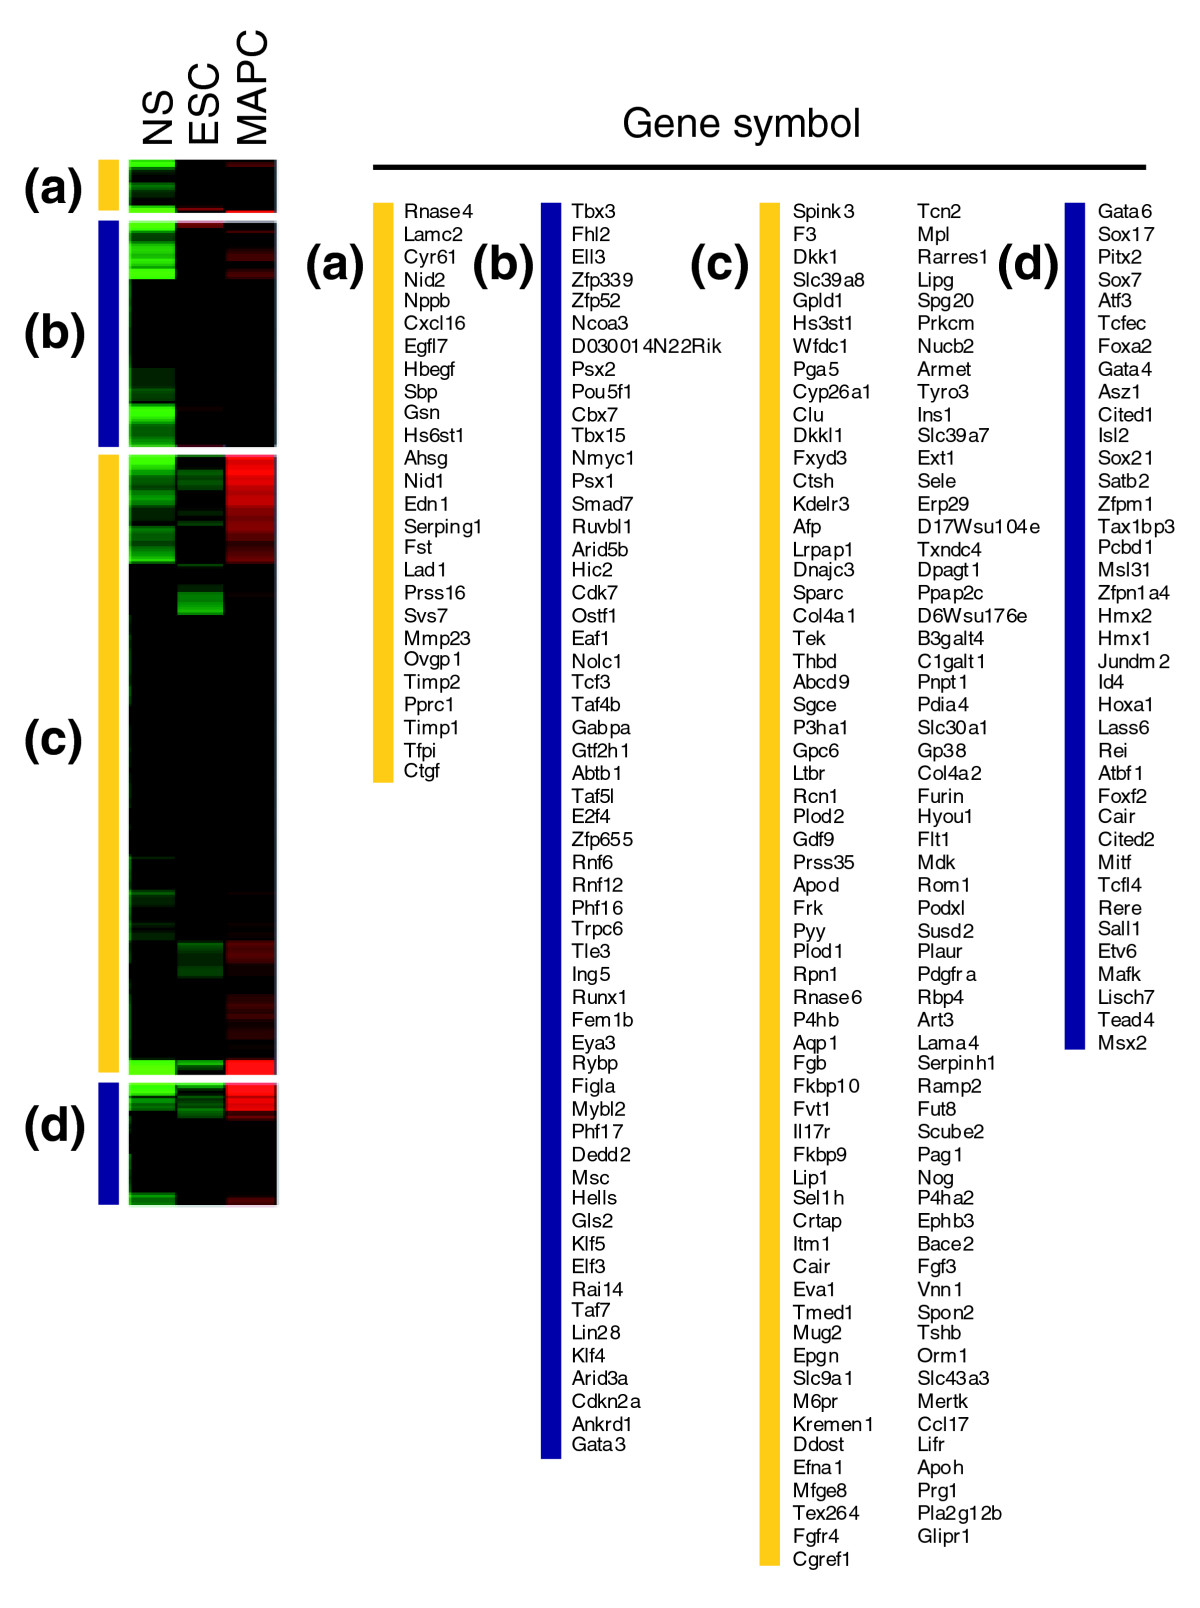
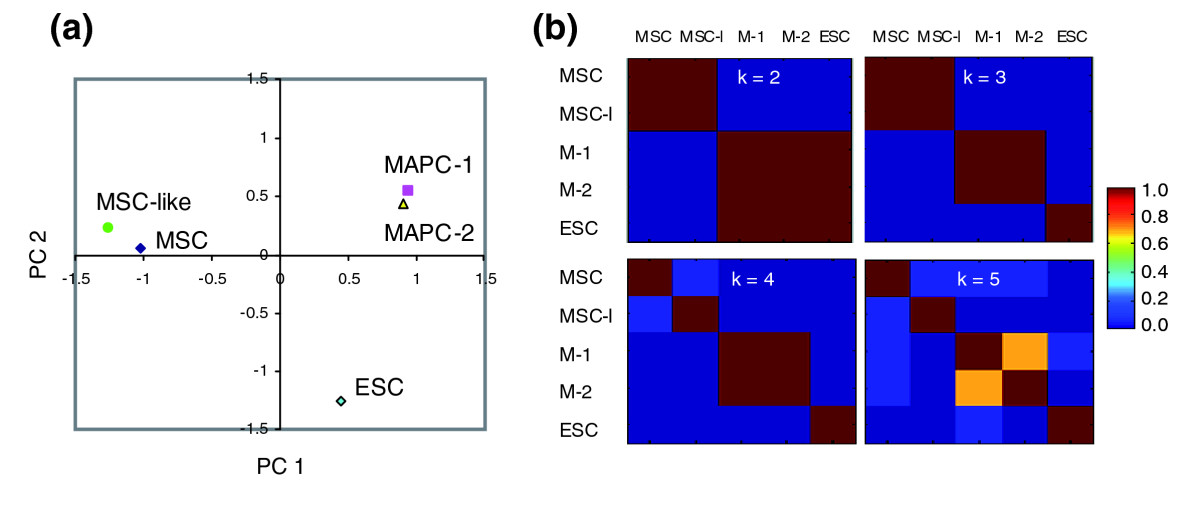
Results: Applying principal component analysis, non-negative matrix factorization and k-means clustering algorithms to the gene-expression data, we identified a unique gene-expression profile for MAPCs. Apart from the ESC-specific transcription factor Oct4 and other ESC transcripts, some of them associated with maintaining ESC pluripotency, MAPCs also express transcripts characteristic of early endoderm and mesoderm. MAPCs do not, however, express Nanog or Sox2, two other key transcription factors involved in maintaining ESC properties. This unique molecular signature was seen irrespective of the microarray platform used and was very similar for both mouse and rat MAPCs. As MSC-like cells isolated under MAPC conditions are virtually identical to MSCs, and MSCs cultured in MAPC conditions do not upregulate MAPC-expressed transcripts, the MAPC signature is cell-type specific and not merely the result of differing culture conditions.
Conclusion: Multivariate analysis techniques clustered stem cells on the basis of their expressed gene profile, and the genes determining this clustering reflected the stem cells' differentiation potential in vitro. This comparative transcriptome analysis should significantly aid the isolation and culture of MAPCs and MAPC-like cells, and form the basis for studies to gain insights into genes that confer on these cells their greater developmental potency.
Figures
Similar articles
-
18F-FDG labeling of mesenchymal stem cells and multipotent adult progenitor cells for PET imaging: effects on ultrastructure and differentiation capacity.J Nucl Med. 2013 Mar;54(3):447-54. doi: 10.2967/jnumed.112.108316. Epub 2013 Jan 25. J Nucl Med. 2013. PMID: 23353687
-
A plethora of human pluripotent stem cells.Cell Biol Int. 2013 Sep;37(9):875-87. doi: 10.1002/cbin.10120. Epub 2013 May 23. Cell Biol Int. 2013. PMID: 23619972 Review.
-
Clinical-Grade Human Multipotent Adult Progenitor Cells Block CD8+ Cytotoxic T Lymphocytes.Stem Cells Transl Med. 2016 Dec;5(12):1607-1619. doi: 10.5966/sctm.2016-0030. Epub 2016 Jul 27. Stem Cells Transl Med. 2016. PMID: 27465071 Free PMC article.
-
Embryonic fibroblasts represent a connecting link between mesenchymal and embryonic stem cells.Dev Growth Differ. 2013 Apr;55(3):330-40. doi: 10.1111/dgd.12043. Epub 2013 Feb 27. Dev Growth Differ. 2013. PMID: 23441817
-
New emerging potentials for human Wharton's jelly mesenchymal stem cells: immunological features and hepatocyte-like differentiative capacity.Stem Cells Dev. 2010 Apr;19(4):423-38. doi: 10.1089/scd.2009.0299. Stem Cells Dev. 2010. PMID: 19958166 Review.
Cited by
-
Multipotent adult progenitor cells on an allograft scaffold facilitate the bone repair process.J Tissue Eng. 2016 Jul 8;7:2041731416656148. doi: 10.1177/2041731416656148. eCollection 2016 Jan-Dec. J Tissue Eng. 2016. PMID: 27493716 Free PMC article.
-
Inhibition of DNA methyltransferases and histone deacetylases induces bone marrow-derived multipotent adult progenitor cells to differentiate into endothelial cells.Ethn Dis. 2010 Winter;20(1 Suppl 1):S1-60-4. Ethn Dis. 2010. PMID: 20521387 Free PMC article.
-
N-acetylcysteine prevents oxidized low-density lipoprotein-induced reduction of MG53 and enhances MG53 protective effect on bone marrow stem cells.J Cell Mol Med. 2020 Jan;24(1):886-898. doi: 10.1111/jcmm.14798. Epub 2019 Nov 19. J Cell Mol Med. 2020. PMID: 31742908 Free PMC article.
-
A Review of the Evidence for Tryptophan and the Kynurenine Pathway as a Regulator of Stem Cell Niches in Health and Disease.Int J Tryptophan Res. 2024 May 15;17:11786469241248287. doi: 10.1177/11786469241248287. eCollection 2024. Int J Tryptophan Res. 2024. PMID: 38757094 Free PMC article. Review.
-
A dynamic notch injury response activates epicardium and contributes to fibrosis repair.Circ Res. 2011 Jan 7;108(1):51-9. doi: 10.1161/CIRCRESAHA.110.233262. Epub 2010 Nov 24. Circ Res. 2011. PMID: 21106942 Free PMC article.
References
Publication types
MeSH terms
Substances
Associated data
- Actions
- Actions
Grants and funding
LinkOut - more resources
Full Text Sources
Other Literature Sources
Molecular Biology Databases
Research Materials
