. 2007 Aug 6:8:291.
doi: 10.1186/1471-2105-8-291.

Portraits of breast cancer progression

Affiliations

Portraits of breast cancer progression

Gul S Dalgin et al. BMC Bioinformatics. .

Abstract

Background: Clustering analysis of microarray data is often criticized for giving ambiguous results because of sensitivity to data perturbation or clustering techniques used. In this paper, we describe a new method based on principal component analysis and ensemble consensus clustering that avoids these problems.

Results: We illustrate the method on a public microarray dataset from 36 breast cancer patients of whom 31 were diagnosed with at least two of three pathological stages of disease (atypical ductal hyperplasia (ADH), ductal carcinoma in situ (DCIS) and invasive ductal carcinoma (IDC). Our method identifies an optimum set of genes and divides the samples into stable clusters which correlate with clinical classification into Luminal, Basal-like and Her2+ subtypes. Our analysis reveals a hierarchical portrait of breast cancer progression and identifies genes and pathways for each stage, grade and subtype. An intriguing observation is that the disease phenotype is distinguishable in ADH and progresses along distinct pathways for each subtype. The genetic signature for disease heterogeneity across subtypes is greater than the heterogeneity of progression from DCIS to IDC within a subtype, suggesting that the disease subtypes have distinct progression pathways. Our method identifies six disease subtype and one normal clusters. The first split separates the normal samples from the cancer samples. Next, the cancer cluster splits into low grade (pathological grades 1 and 2) and high grade (pathological grades 2 and 3) while the normal cluster is unchanged. Further, the low grade cluster splits into two subclusters and the high grade cluster into four. The final six disease clusters are mapped into one Luminal A, three Luminal B, one Basal-like and one Her2+.

Conclusion: We confirm that the cancer phenotype can be identified in early stage because the genes altered in this stage progressively alter further as the disease progresses through DCIS into IDC. We identify six subtypes of disease which have distinct genetic signatures and remain separated in the clustering hierarchy. Our findings suggest that the heterogeneity of disease across subtypes is higher than the heterogeneity of the disease progression within a subtype, indicating that the subtypes are in fact distinct diseases.


Figures

Figure 1
Figure 1
Flow chart of the analysis method: The method starts with data normalization and proceeds to the identification of predictive genes using principal component analysis to ensemble clustering into k = 2,3,... clusters. The clusters are then analyzed to identify their characteristic gene patterns which are then used to find altered pathways associated with the disease process.
Figure 2
Figure 2
Hierarchical nature of breast cancer progression: Consensus ensemble k-clustering tree reveals the recursive splitting of breast cancer subtypes. At k = 2, the ensemble clustering split the normal samples from the disease samples. At k = 3, the normal cluster remained unchanged and the disease samples split into low grade (pathological grades 1 and 2) and high grade (pathological grades 2 and 3). The optimum number of clusters in the data was seven corresponding to one normal cluster, two low grade clusters and four high grade clusters. Between two k values, the samples did not switch clusters, indicating that the hierarchical structure in the figure is a strong property of the data. In the final disease clusters, samples from the same patient microdissected from DCIS and IDC lesions were found in the same cluster, indicating that the disease subtypes are more heterogeneous than disease progression within a subtype.
Figure 3
Figure 3
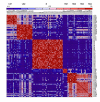
Heatmap of agreement matrix for seven clusters: The agreement matrix for NS samples is an NS × NS matrix whose entries are the fraction of cases across replicates for which two samples fall into the same cluster. Red/green represent high/low fractional values across clustering methods and data perturbation replicates. The normals and the LG1 and LG2 are clearly well separated while the HG1, HG2, HG3 and HG4 separation is weaker. We find that the optimum number of clusters using gap-statistics oscillates between 6 and 7 with the HG3 and HG4 clusters merging at k-6.
Figure 4
Figure 4
Subtype heatmap using the top 10 markers: Red/green represent up/down regulation relative to black. Each subgroup is shown in a framed box to identify its samples and distinguish gene markers. The signatures of the genes specific to each subtype stand out distinctly compared to all other subtypes.
Figure 5
Figure 5
Low-High grade progression heatmap: Heatmap of expression levels of the top markers for progression from DCIS to IDC in the low grade and high grade tumor subgroups. In each subtype, we use the upregulated genes which have good FDR under WV to stratify the samples. We show the 10 top genes for DCIS to IDC progression in LG and HG tumors. Since the sample sizes were small, the p values were computed using permutation tests and the FDR values were computed from these p values. The FDR values under WV for these genes are 0.6 for LG and 0.2 for HG.
Figure 6
Figure 6
DCIS to IDC progression heatmap: Heatmap of expression levels of the top 10 upregulated genes for progression from DCIS to IDC for each subtype. Each subgroup is in a framed box to identify its samples and distinguish gene markers. Since the sample sizes are small, the p values were computed using permutation tests and the FDR rates inferred from these p values. The FDR rates under WV for these genes are: 0.02 for LG1, 0.2 for LG2, 0.2 for HG1, 0.5 for HG2, 0.06 for HG3 and 0.002 for HG4.
Figure 7
Figure 7
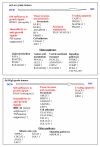
Pathways affected in low and high-grade tumors. Progression models for low and high grade tumors identified from functional analysis of genes characteristic of subtypes. Marker genes were placed into Hanahan-Weinberg [16] categories which are shown in red. Our results are in general agreement with the expectation that activation of oncogenes and loss of tumor suppressor genes are early events seen in low grade tumors and induction of angiogenesis is an early to mid-stage event seen in high grade tumors [23].

Similar articles

Cited by

References

    1. Gruvberger S, Ringner M, Chen Y, Panavally S, Saal LH, Borg A, Ferno M, Peterson C, Meltzer PS. Estrogen receptor status in breast cancer is associated with remarkably distinct gene expression patterns. Cancer Res. 2001;61:5979–5984. - PubMed
    1. Mauriac L. Aromatase inhibitors: Effective endocrine therapy in the early adjuvant setting for postmenopausal women with hormone-responsive breast cancer. Best Pract Res Clin Endocrinol Metab. 2006;20:S15–29.
    1. Morris SR, Carey LA. Molecular profiling in breast cancer. Rev Endocr Metab Disord. 2007 - PubMed
    1. Sorlie T, Wang Y, Xiao C, Johnsen H, Naume B, Samaha RR, Borresen-Dale AL. Distinct molecular mechanisms underlying clinically relevant subtypes of breast cancer: Gene expression analyses across three different platforms. BMC genomics. 2006;7:127. - PMC - PubMed
    1. Perou CM, Sorlie T, Eisen MB, van de Rijn M, Jeffrey SS, Rees CA, Pollack JR, Ross DT, Johnsen H, Akslen LA, et al. Molecular portraits of human breast tumours. Nature. 2000;406:747–752. - PubMed

Publication types

MeSH terms