Technical evaluation of in vivo abdominal fat and IMCL quantification using MRI and MRSI at 3 T
- PMID: 17683890
- PMCID: PMC2713003
- DOI: 10.1016/j.mri.2007.06.006
Technical evaluation of in vivo abdominal fat and IMCL quantification using MRI and MRSI at 3 T
Abstract
Objectives: The objectives of this study were to develop protocols that measure abdominal fat and calf muscle lipids with magnetic resonance imaging (MRI) and magnetic resonance spectroscopy (MRS), respectively, at 3 T and to examine the correlation between these parameters and insulin sensitivity.
Materials and methods: Ten nondiabetic subjects [five insulin-sensitive (IS) subjects and five insulin-resistant (IR) subjects] were scanned at 3 T. Visceral adipose tissue (VAT) and subcutaneous adipose tissue (SAT) were segmented semiautomatically from abdominal imaging. Intramyocellular lipids (IMCL) in calf muscles were quantified with single-voxel MRS in both soleus and tibialis anterior muscles and with magnetic resonance spectroscopic imaging (MRSI).
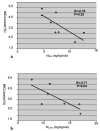
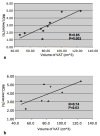
Results: The average coefficient of variation (CV) of VAT/(VAT+SAT) was 5.2%. The interoperator CV was 1.1% and 5.3% for SAT and VAT estimates, respectively. The CV of IMCL was 13.7% in soleus, 11.9% in tibialis anterior and 2.9% with MRSI. IMCL based on MRSI (3.8+/-1.2%) were significantly inversely correlated with glucose disposal rate, as measured by a hyperinsulinemic-euglycemic clamp. VAT volume correlated significantly with IMCL. IMCL based on MRSI for IR subjects was significantly greater than that for IS subjects (4.5+/-0.9% vs. 2.8+/-0.5%, P=.02).
Conclusion: MRI and MRS techniques provide a robust noninvasive measurement of abdominal fat and muscle IMCL, which are correlated with insulin action in humans.
Figures


References
-
- Reaven G. Banting lecture 1988. Role of insulin resistance in human disease Diabetes. 1988;37(12):1595–1607. - PubMed
-
- Groop LC, Bonadonna RC, Simonson DC, Petrides AS, Shank M, RA D. Effect of insulin on oxidative and nonoxidative pathways of free fatty acid metabolism in human obesity. Am J Physiol. 1992;263(1 pt 1):E79–84. - PubMed
-
- Machann J, Haring H, Schick F, MS Intramyocellular lipids and insulin resistance. Diabetes Obes Metab. 2004;6(4):239–248. - PubMed
-
- Falholt K, Jensen I, Lindkaer Jensen S, Mortensen H, Volund A, Heding LG, Noerskov Petersen P, W F. Carbohydrate and lipid metabolism of skeletal muscle in type 2 diabetic patients. Diabet Med. 1988;5(1):27–31. - PubMed
-
- Pan DA, Lillioja S, Kriketos AD, Milner MR, Baur LA, Bogardus C, Jenkins AB, LHS Skeletal muscle triglyceride levels are inversely related to insulin action. Diabetes. 1997;46(6):983–988. - PubMed
Publication types
MeSH terms
Substances
Grants and funding
LinkOut - more resources
Full Text Sources
Medical
Research Materials

