

Two new nuclear isolation buffers for plant DNA flow cytometry: a test with 37 species
- PMID: 17684025
- PMCID: PMC2749623
- DOI: 10.1093/aob/mcm152
Two new nuclear isolation buffers for plant DNA flow cytometry: a test with 37 species
Abstract
Background and aims: After the initial boom in the application of flow cytometry in plant sciences in the late 1980s and early 1990s, which was accompanied by development of many nuclear isolation buffers, only a few efforts were made to develop new buffer formulas. In this work, recent data on the performance of nuclear isolation buffers are utilized in order to develop new buffers, general purpose buffer (GPB) and woody plant buffer (WPB), for plant DNA flow cytometry.
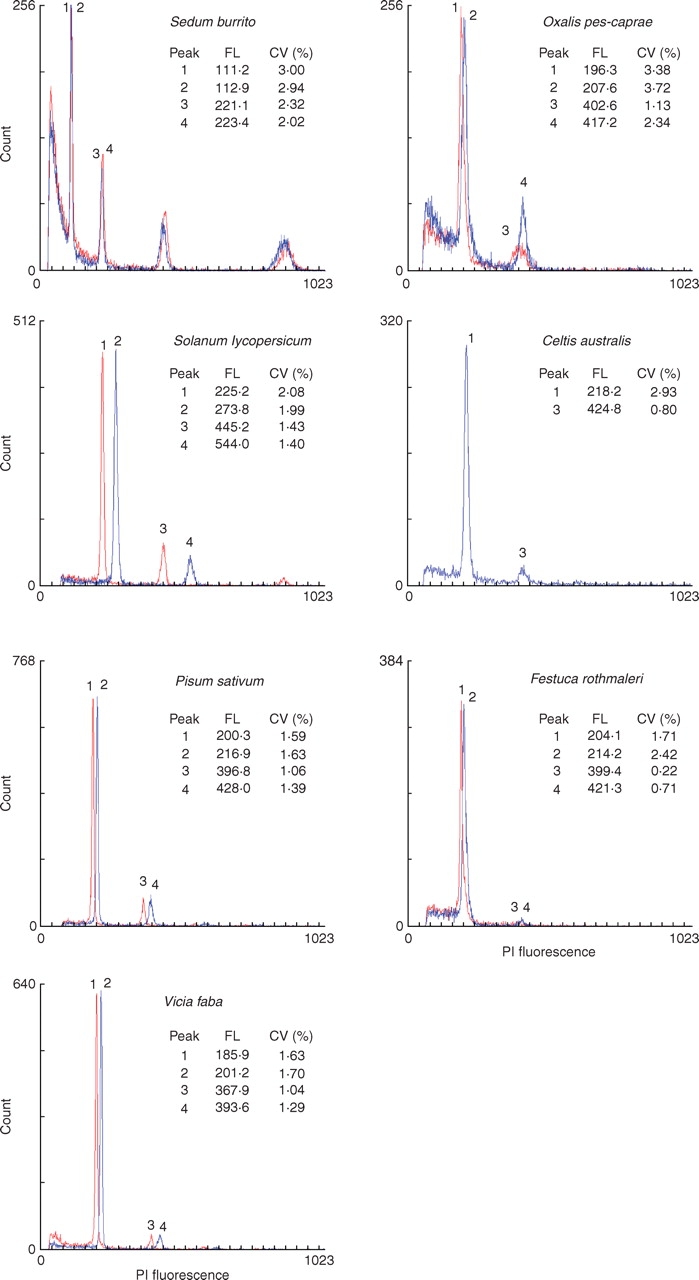
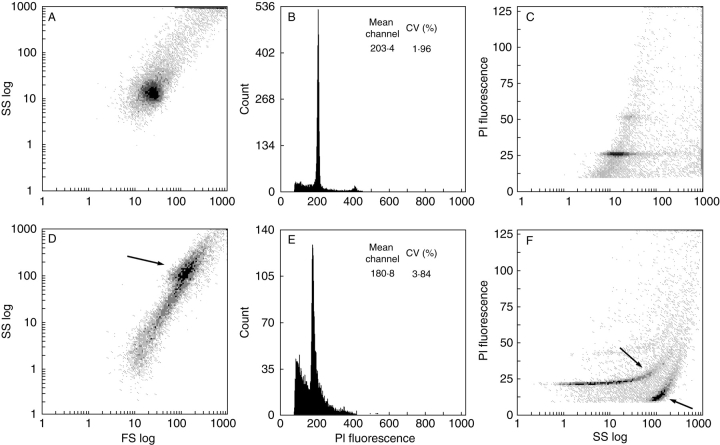
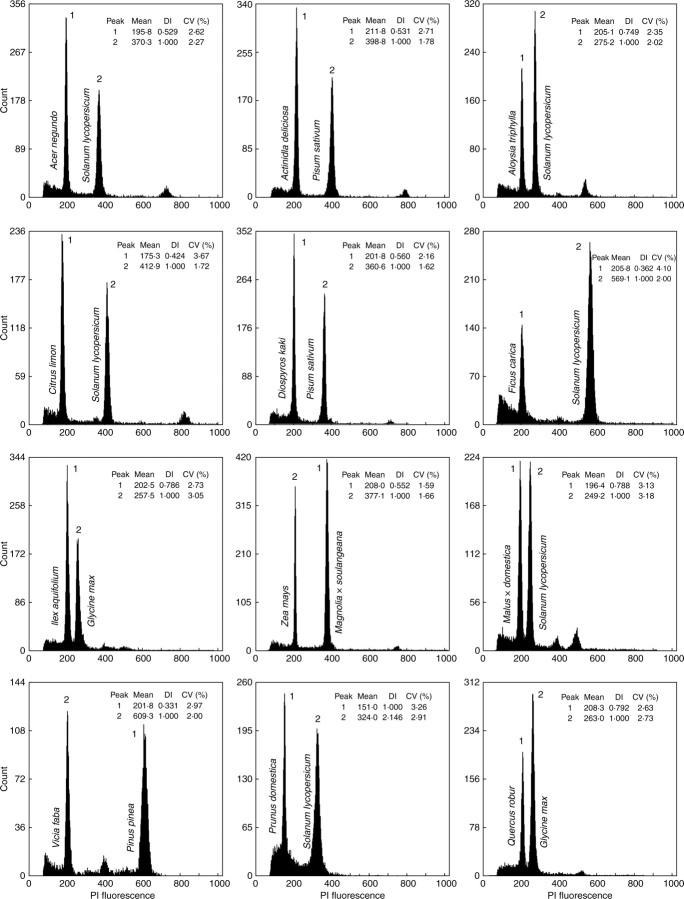
Methods: GPB and WPB were used to prepare samples for flow cytometric analysis of nuclear DNA content in a set of 37 plant species that included herbaceous and woody taxa with leaf tissues differing in structure and chemical composition. The following parameters of isolated nuclei were assessed: forward and side light scatter, propidium iodide fluorescence, coefficient of variation of DNA peaks, quantity of debris background, and the number of particles released from sample tissue. The nuclear genome size of 30 selected species was also estimated using the buffer that performed better for a given species.
Key results: In unproblematic species, the use of both buffers resulted in high quality samples. The analysis of samples obtained with GPB usually resulted in histograms of DNA content with higher or similar resolution than those prepared with the WPB. In more recalcitrant tissues, such as those from woody plants, WPB performed better and GPB failed to provide acceptable results in some cases. Improved resolution of DNA content histograms in comparison with previously published buffers was achieved in most of the species analysed.
Conclusions: WPB is a reliable buffer which is also suitable for the analysis of problematic tissues/species. Although GPB failed with some plant species, it provided high-quality DNA histograms in species from which nuclear suspensions are easy to prepare. The results indicate that even with a broad range of species, either GPB or WPB is suitable for preparation of high-quality suspensions of intact nuclei suitable for DNA flow cytometry.
Figures
Similar articles
-
Comparison of four nuclear isolation buffers for plant DNA flow cytometry.Ann Bot. 2006 Sep;98(3):679-89. doi: 10.1093/aob/mcl141. Epub 2006 Jul 4. Ann Bot. 2006. PMID: 16820407 Free PMC article.
-
Novel nuclei isolation buffer for flow cytometric genome size estimation of Zingiberaceae: a comparison with common isolation buffers.Ann Bot. 2016 Nov;118(6):1057-1070. doi: 10.1093/aob/mcw173. Epub 2016 Sep 4. Ann Bot. 2016. PMID: 27594649 Free PMC article.
-
Flow cytometric and microscopic analysis of the effect of tannic acid on plant nuclei and estimation of DNA content.Ann Bot. 2006 Sep;98(3):515-27. doi: 10.1093/aob/mcl140. Epub 2006 Jul 4. Ann Bot. 2006. PMID: 16820406 Free PMC article.
-
Reference standards for flow cytometric estimation of absolute nuclear DNA content in plants.Cytometry A. 2022 Sep;101(9):710-724. doi: 10.1002/cyto.a.24495. Epub 2021 Aug 18. Cytometry A. 2022. PMID: 34405937 Free PMC article. Review.
-
Isolation of plant nuclei for estimation of nuclear DNA content: Overview and best practices.Cytometry A. 2021 Apr;99(4):318-327. doi: 10.1002/cyto.a.24331. Epub 2021 Mar 10. Cytometry A. 2021. PMID: 33751820 Review.
Cited by
-
Quantitative testing of the methodology for genome size estimation in plants using flow cytometry: a case study of the Primulina genus.Front Plant Sci. 2015 May 19;6:354. doi: 10.3389/fpls.2015.00354. eCollection 2015. Front Plant Sci. 2015. PMID: 26042140 Free PMC article.
-
Flow cytometry reveals that the rust fungus, Uromyces bidentis (Pucciniales), possesses the largest fungal genome reported--2489 Mbp.Mol Plant Pathol. 2015 Dec;16(9):1006-10. doi: 10.1111/mpp.12255. Epub 2015 May 4. Mol Plant Pathol. 2015. PMID: 25784533 Free PMC article.
-
Cytogenetic, Morphometric, and Ecological Characterization of Festuca indigesta Boiss. in the Southeast of Spain.Plants (Basel). 2022 Mar 4;11(5):693. doi: 10.3390/plants11050693. Plants (Basel). 2022. PMID: 35270163 Free PMC article.
-
Genome size evolution of the extant lycophytes and ferns.Plant Divers. 2022 Jan 1;44(2):141-152. doi: 10.1016/j.pld.2021.11.007. eCollection 2022 Mar. Plant Divers. 2022. PMID: 35505989 Free PMC article.
-
The nature of intraspecific and interspecific genome size variation in taxonomically complex eyebrights.Ann Bot. 2021 Sep 7;128(5):639-651. doi: 10.1093/aob/mcab102. Ann Bot. 2021. PMID: 34318876 Free PMC article.
References
-
- Albers F, Pröbsting W. Chromosomenatlas der Farn- und Blütenpflanzen Deutschlands. In: Wisskirchen R, Haeupler H, editors. Standardliste der Farn- und Blütenpflanzen Deutschlands. Stuttgart: Bundesamt für Naturschutz & Verlag; 1998. pp. 562–616.
-
- Arumuganathan K, Earle E. Estimation of nuclear DNA content of plants by flow cytometry. Plant Molecular Biology Reporter. (a) 1991;9:229–233.
-
- Arumuganathan K, Earle E. Nuclear DNA content of some important plant species. Plant Molecular Biology Reporter. (b) 1991;9:208–218.
-
- Baird WV, Estager AS, Wells JK. Estimating nuclear DNA content in peach and related diploid species using laser flow cytometry and DNA hybridization. Journal of the American Society for Horticultural Science. 1994;119:1312–1316.
-
- Barow M, Meister A. Lack of correlation between AT frequency and genome size in higher plants and the effect of nonrandomness of base sequences on dye binding. Cytometry. 2002;47:1–7. - PubMed
Publication types
MeSH terms
Substances
LinkOut - more resources
Full Text Sources
Other Literature Sources
