. 2007 Aug 14;104(33):13343-8.
doi: 10.1073/pnas.0705815104. Epub 2007 Aug 7.

Spatio-temporal analysis of eukaryotic cell motility by improved force cytometry

Affiliations

Spatio-temporal analysis of eukaryotic cell motility by improved force cytometry

Juan C Del Alamo et al. Proc Natl Acad Sci U S A. .

Abstract

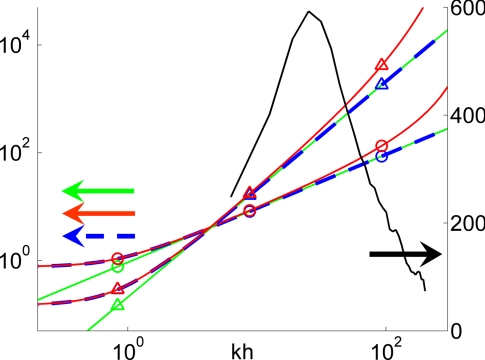
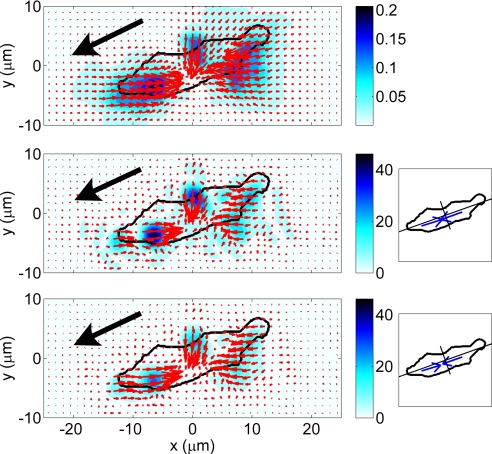
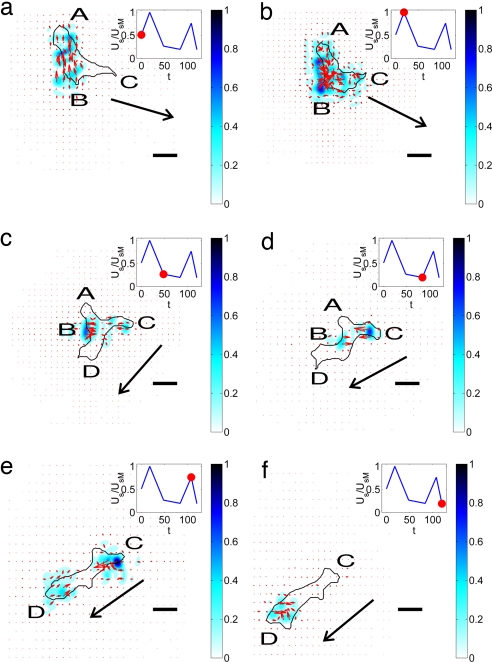
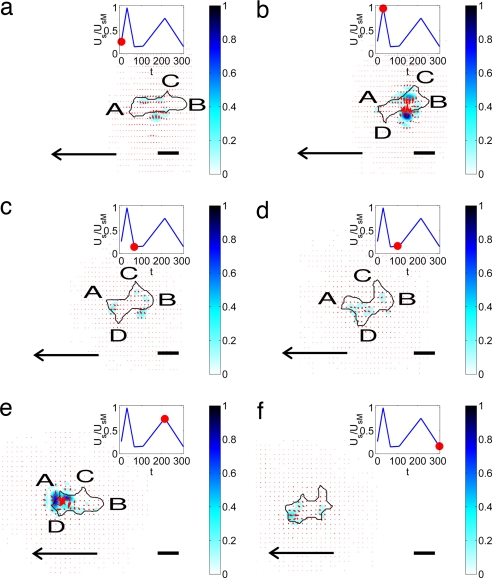
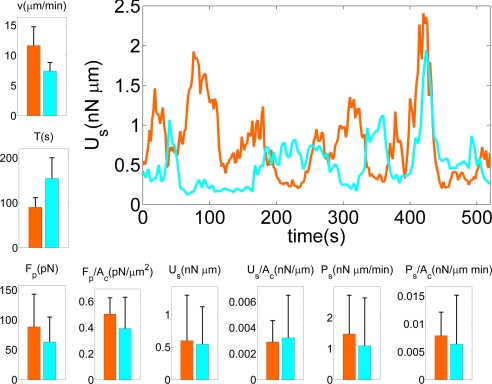
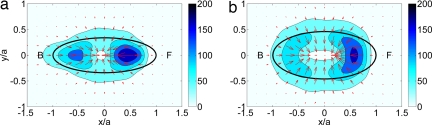
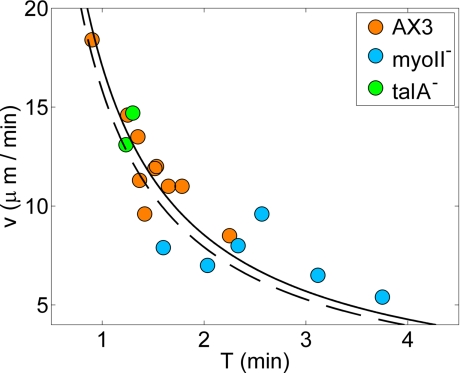
Cell motility plays an essential role in many biological systems, but precise quantitative knowledge of the biophysical processes involved in cell migration is limited. Better measurements are needed to ultimately build models with predictive capabilities. We present an improved force cytometry method and apply it to the analysis of the dynamics of the chemotactic migration of the amoeboid form of Dictyostelium discoideum. Our explicit calculation of the force field takes into account the finite thickness of the elastic substrate and improves the accuracy and resolution compared with previous methods. This approach enables us to quantitatively study the differences in the mechanics of the migration of wild-type (WT) and mutant cell lines. The time evolution of the strain energy exerted by the migrating cells on their substrate is quasi-periodic and can be used as a simple indicator of the stages of the cell motility cycle. We have found that the mean velocity of migration v and the period of the strain energy T cycle are related through a hyperbolic law v = L/T, where L is a constant step length that remains unchanged in mutants with adhesion or contraction defects. Furthermore, when cells adhere to the substrate, they exert opposing pole forces that are orders of magnitude higher than required to overcome the resistance from their environment.


Conflict of interest statement

The authors declare no conflict of interest.

Figures

Fig. 1.
Fig. 1.
Spectral analysis of our solution and Boussinesq's solution of the elastostatic equation. The color curves follow the left vertical axis and represent the first (circles) and second (triangles) invariants of the matrix that converts the Fourier coefficients of the measured displacements into those of the tangential stresses on the substrate surface. Green, Boussinesq solution; blue, our solution with h = h0; red, our solution with h = 1.003h0. The black curve follows the right vertical axis and shows the spectral energy density of the displacements field in Fig. 2 Top.
Fig. 2.
Fig. 2.
Analysis of the movement behavior of a Dictyostelium cell migrating up a gradient of the chemoattractant cAMP emitted from a micropipette (see SI Appendix A). The arrows indicate the intensity and direction of the vector data. The color contours indicate their intensity according to the color bars. The black arrow indicates the direction of motion of the cell. (Top) Instantaneous displacements in micrometers. (Middle and Bottom) Instantaneous stresses in pascals; the diagrams on the right show the cell's principal axes and the front (Ff) and back (Fb) pole forces. (Middle) hh0 = 0.4 μm; Ff = 156 pN, Fb = 162 pN. (Bottom), h = h0; Ff = 143 pN, Fb = 149 pN.
Fig. 3.
Fig. 3.
Sequence of images of a moving WT Dictyostelium cell. The black contour is the outline of the cell. The color contours map the magnitude of the stresses produced by the cell relative to their maximum value. The red arrows indicate the magnitude and direction of these stresses. The plot at the upper right corner of each panel indicates the strain energy of the substrate for the selected images. The red circle in that plot indicates the instant of time that corresponds to each panel: (a) t = 0 s; (b) t = 18 s; (c) t = 48 s; (d) t = 84 s; (e) t = 100 s; (f) t = 112 s. (Scale bars: 10 μm.) The arrow indicates the direction of motion of the cell.
Fig. 4.
Fig. 4.
Sequence of images of a chemotaxing myoII Dictyostelium cell, similar to Fig. 3. (a) t = 0 s. (b) t = 28 s. (c) t = 64 s. (d) t = 100 s. (e) t = 216 s. (f) t = 308 s.
Fig. 5.
Fig. 5.
The bar plots compare motility statistics for WT (n = 10) and myoII (n = 6) cells. The black vertical lines indicate the standard deviation. From top to bottom and from left to right: average velocity of the cell centroid (v); average period of the strain energy (T) (single periods are computed from the time autocorrelation function of the strain energy); average magnitude of the pole forces obtained from the integration of the stresses in the front and the back of the cells (Fp); average magnitude of the pole forces normalized with cell area (Fp/Ac); average strain energy (Us); average strain energy normalized with cell area (Us/Ac); average elastic power estimated from the average strain energy and its average peak to peak period (Ps); average elastic power normalized with cell area (Ps/Ac). The curve plot on the right of the figure shows examples of the time evolution of the strain energy for a WT (orange) and a myoII (cyan) cell.
Fig. 6.
Fig. 6.
Average force field produced by the cells on their substrate, computed in a cell-based reference system rotated to coincide with the instantaneous principal axes of the cells and scaled with the length of their instantaneous major axis, a. The color contours indicate the magnitude of the forces in pN, and the arrows indicate their magnitude and direction. The black ellipses are least squares fits to the average shape of the cells in the cell-based reference system. The front (F) of the cell corresponds to x > 0 and the back (B) corresponds to x < 0. (a) WT cells (n = 10). (b) myoII (n = 6).
Fig. 7.
Fig. 7.
Scatter plot of the average velocity of the of WT (orange), myoII (cyan), and talA (green) cells plotted versus the peak-to-peak period of the strain energy. The solid and dashed hyperbolas (v = L/T) are least squares fits to the data from WT and myoII cells. The corresponding values of L are 17 and 16 μm.

References

    1. Lauffenburger D, Horwitz A. Cell. 1996;84:359–369. - PubMed
    1. Pollard TD, Borisy GG. Cell. 2003;112:453–465. - PubMed
    1. Ridley AJ, Schwartz MA, Burridge K, Firtel RA, Ginsberg MH, Borisy G, Parsons JT, Horwitz AR. Science. 2003;302:1704–1709. - PubMed
    1. Li S, Guan J, Chien S. Annu Rev Biomed Eng. 2005;7:105–150. - PubMed
    1. Charest PG, Firtel RA. Biochem J. 2007;401:377–390. - PMC - PubMed

Publication types

LinkOut - more resources