. 2007 Aug 8;2(8):e708.
doi: 10.1371/journal.pone.0000708.

Extensive gains and losses of olfactory receptor genes in mammalian evolution

Affiliations

Extensive gains and losses of olfactory receptor genes in mammalian evolution

Yoshihito Niimura et al. PLoS One. .

Abstract

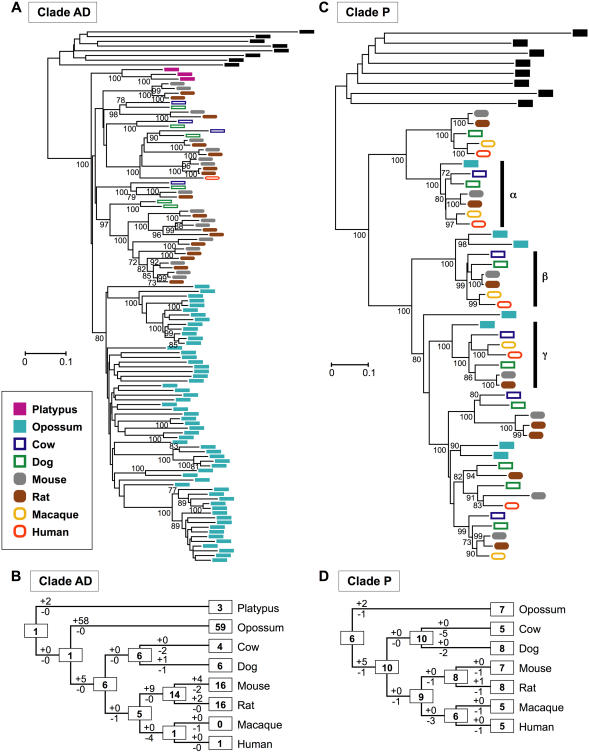
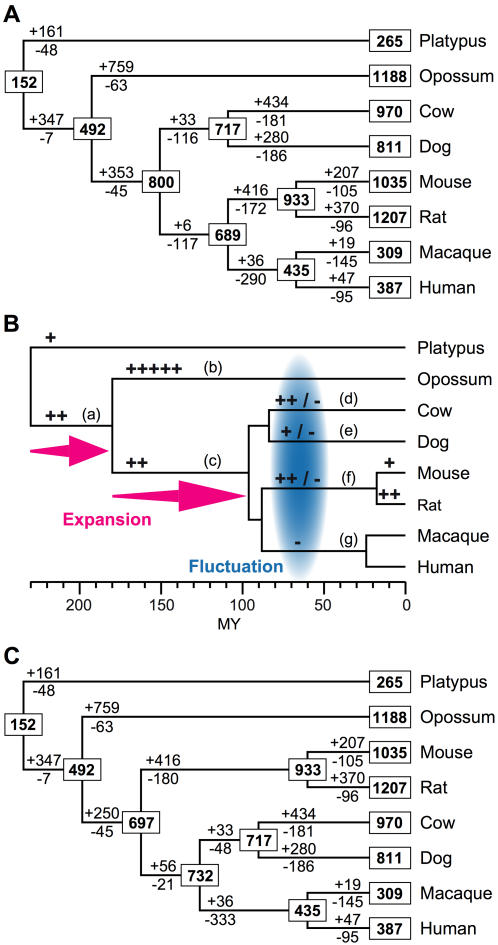
Odor perception in mammals is mediated by a large multigene family of olfactory receptor (OR) genes. The number of OR genes varies extensively among different species of mammals, and most species have a substantial number of pseudogenes. To gain some insight into the evolutionary dynamics of mammalian OR genes, we identified the entire set of OR genes in platypuses, opossums, cows, dogs, rats, and macaques and studied the evolutionary change of the genes together with those of humans and mice. We found that platypuses and primates have <400 functional OR genes while the other species have 800-1,200 functional OR genes. We then estimated the numbers of gains and losses of OR genes for each branch of the phylogenetic tree of mammals. This analysis showed that (i) gene expansion occurred in the placental lineage each time after it diverged from monotremes and from marsupials and (ii) hundreds of gains and losses of OR genes have occurred in an order-specific manner, making the gene repertoires highly variable among different orders. It appears that the number of OR genes is determined primarily by the functional requirement for each species, but once the number reaches the required level, it fluctuates by random duplication and deletion of genes. This fluctuation seems to have been aided by the stochastic nature of OR gene expression.


Conflict of interest statement

Competing Interests: The authors have declared that no competing interests exist.

Figures

Figure 1
Figure 1. Gains and losses of OR genes during mammalian evolution.
(A) NJ tree for 105 Clade AD genes and eight outgroup genes. The outgroup genes used are human Class II genes belonging to Clades A–H and are shown in black. The number of amino acids used is 288. Bootstrap values were obtained by 500 resamplings, and only the values that are >70% are shown. A scale bar indicates the number of amino acid substitutions per site. (B) Evolutionary changes of the number of Clade AD genes inferred from data in (A). The Euarchontoglires tree topology and a 70% bootstrap condensed tree were used for the estimation. The numbers in rectangular boxes are those of Clade AD functional genes for the extant or ancestral species. The numbers with plus and minus signs for a branch indicate gene gains and losses, respectively. (C) NJ tree for 45 Clade P genes and eight outgroup genes. The number of amino acids used is 290. Bootstrap values >70% are shown. Phylogenetic clades indicated by α and γ contain one gene from each of the seven species (opossums and placentals), and a clade shown by β contains one gene from each of the six placental mammals. (D) Evolutionary changes of the number of Clade P genes inferred from data in (C). Platypuses are not shown, because they lack Clade P genes. A 70% bootstrap condensed tree was used.
Figure 2
Figure 2. Evolutionary changes of the number of OR genes in mammals.
(A) The numbers in rectangular boxes are those of functional OR genes for the extant or ancestral species. The Euarchontoglires tree topology is used. We used a 70% bootstrap condensed tree of OR genes, but the results were essentially the same when 50%, 60%, 80%, and 90% bootstrap condensed trees were used (see Table S1 and Figure S4A). (B) Schematic representation of the results of (A). A plus sign and a minus sign for a branch represent 150 gene gains and losses, respectively. The evolutionary timescale is shown at the bottom in million years (MY). The divergence times were obtained from Murphy et al. except for the time of the human-macaque divergence, which was taken from Glazko and Nei . (C) Results obtained by using the mouse-outside tree and a 70% bootstrap condensed tree. The results for 50%, 60%, 80%, and 90% bootstrap condensed trees were given in Table S2 and Figure S4B.

Similar articles

Cited by

References

    1. Buck L, Axel R. A novel multigene family may encode odorant receptors: a molecular basis for odor recognition. Cell. 1991;65:175–187. - PubMed
    1. Mombaerts P. Genes and ligands for odorant, vomeronasal and taste receptors. Nat Rev Neurosci. 2004;5:263–278. - PubMed
    1. Niimura Y, Nei M. Evolutionary dynamics of olfactory and other chemosensory receptor genes in vertebrates. J Hum Genet. 2006;51:505–517. - PMC - PubMed
    1. Glusman G, Yanai I, Rubin I, Lancet D. The complete human olfactory subgenome. Genome Res. 2001;11:685–702. - PubMed
    1. Zozulya S, Echeverri F, Nguyen T. The human olfactory receptor repertoire. Genome Biol. 2001;2:RESEARCH0018. - PMC - PubMed

Publication types

Substances