. 2007 Aug 8;2(8):e722.
doi: 10.1371/journal.pone.0000722.

Global profiling of DNA replication timing and efficiency reveals that efficient replication/firing occurs late during S-phase in S. pombe

Affiliations

Global profiling of DNA replication timing and efficiency reveals that efficient replication/firing occurs late during S-phase in S. pombe

Majid Eshaghi et al. PLoS One. .

Abstract

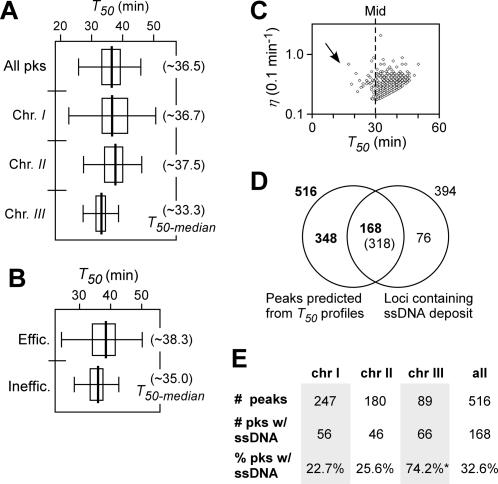
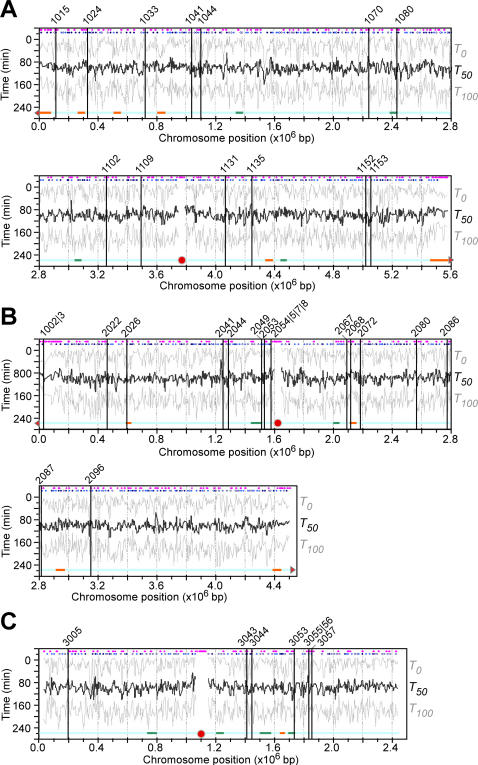
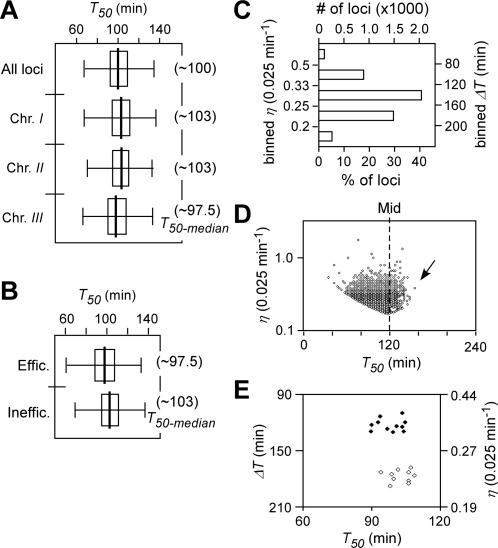
Background: During S. pombe S-phase, initiation of DNA replication occurs at multiple sites (origins) that are enriched with AT-rich sequences, at various times. Current studies of genome-wide DNA replication profiles have focused on the DNA replication timing and origin location. However, the replication and/or firing efficiency of the individual origins on the genomic scale remain unclear.

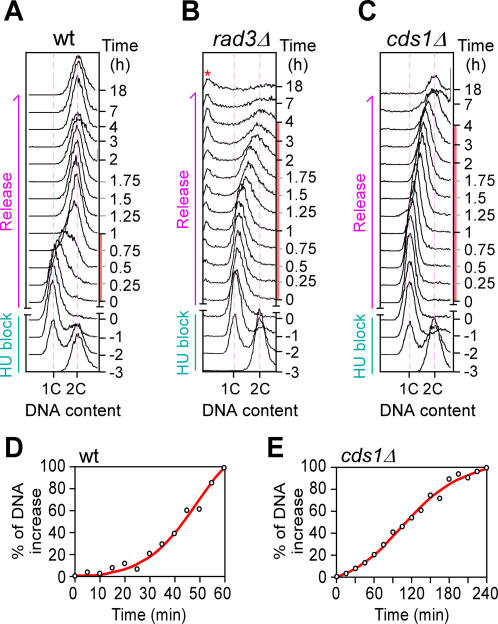
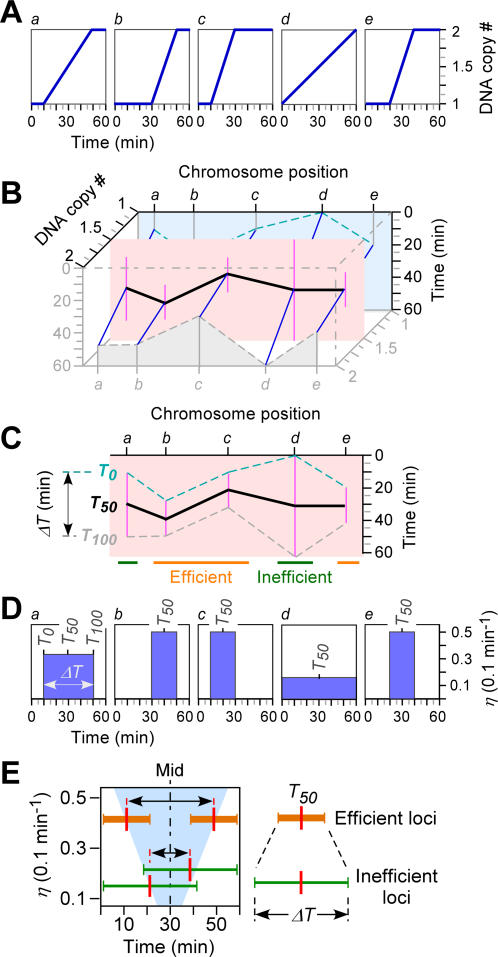
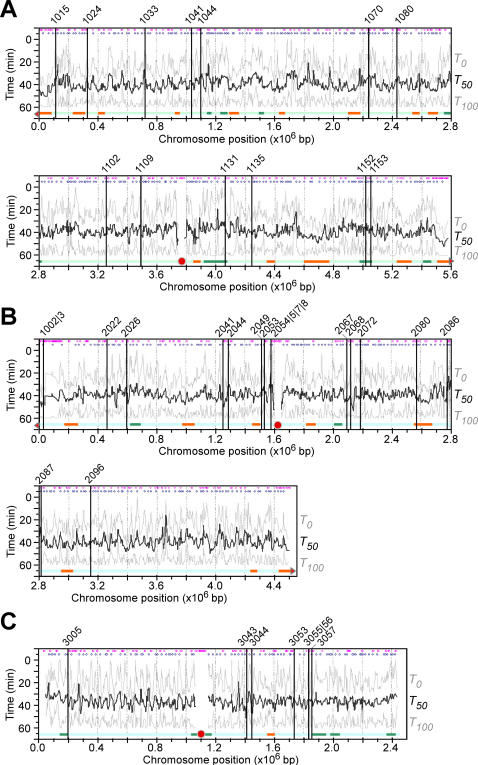
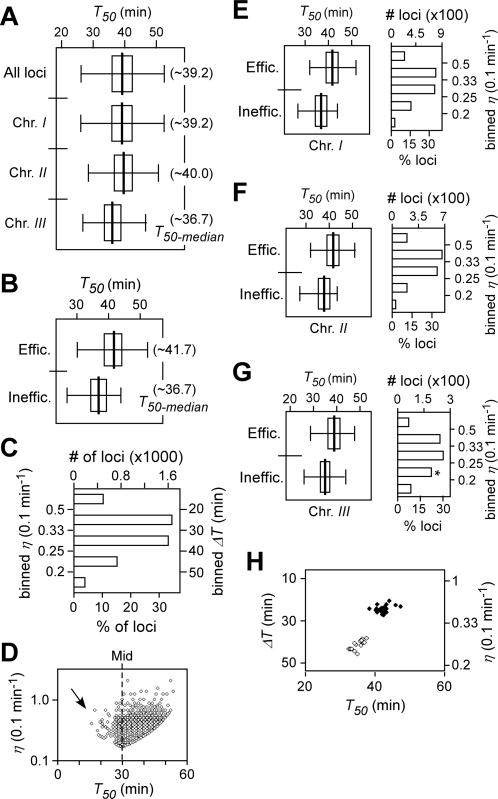
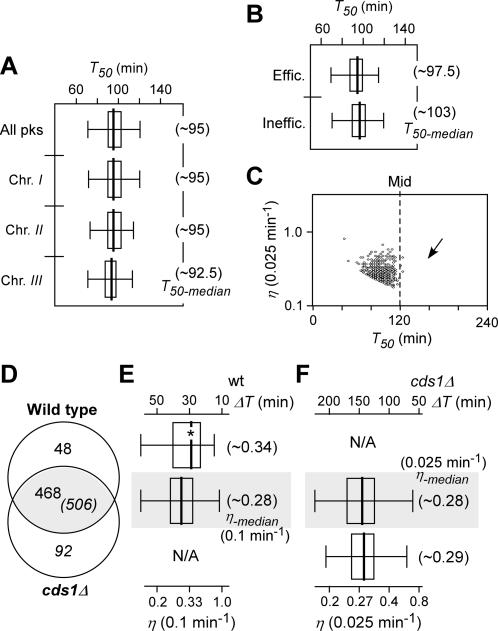
Methodology/principal findings: Using the genome-wide ORF-specific DNA microarray analysis, we show that in S. pombe, individual origins fire with varying efficiencies and at different times during S-phase. The increase in DNA copy number plotted as a function of time is approximated to the near-sigmoidal model, when considering the replication start and end timings at individual loci in cells released from HU-arrest. Replication efficiencies differ from origin to origin, depending on the origin's firing efficiency. We have found that DNA replication is inefficient early in S-phase, due to inefficient firing at origins. Efficient replication occurs later, attributed to efficient but late-firing origins. Furthermore, profiles of replication timing in cds1Delta cells are abnormal, due to the failure in resuming replication at the collapsed forks. The majority of the inefficient origins, but not the efficient ones, are found to fire in cds1Delta cells after HU removal, owing to the firing at the remaining unused (inefficient) origins during HU treatment.

Conclusions/significance: Taken together, our results indicate that efficient DNA replication/firing occurs late in S-phase progression in cells after HU removal, due to efficient late-firing origins. Additionally, checkpoint kinase Cds1p is required for maintaining the efficient replication/firing late in S-phase. We further propose that efficient late-firing origins are essential for ensuring completion of DNA duplication by the end of S-phase.


Conflict of interest statement

Competing Interests: The authors have declared that no competing interests exist.

Figures

Figure 1
Figure 1. Characterization of the DNA-content increase in HU-treated cells.
DNA content profiles by FACS analysis in HU-challenged wild type (A), rad3Δ (B), and cds1Δ (C) cells. 1C and 2C indicate cells containing 1 and 2 copies of genome, respectively. Minus and plus times indicate cells before and after HU-release, respectively. Regression analysis of DNA content increase in wild type (E) and cds1Δ (F) cells. X- and Y-axis indicate the time after HU-removal and the percent of DNA content (i.e., median) increase, respectively.
Figure 2
Figure 2. Schematic modeling of the near-sigmoid regression for profiling of DNA replication timing and efficiency.
(A) Modeling of the near-sigmoid regression for the increase in DNA copy number at indicated individual loci (a–e). (B) Profile assembly of the copy number changes at individual loci of the subchromosomal region. (C) Simplified form of replication profiles displaying average replication timing T50 and duplication time ΔT. (D) Conversion between duplication time ΔT and replication efficiency η. (E) Potential distribution of the T50 versus η at individual loci of the genome.
Figure 3
Figure 3. Global profiles of DNA replication timing and efficiency in wild type cells released from HU block.
X- and Y-axis are times after HU removal and physical locations of individual loci of chromosome I (A), II (B), and III (C), respectively. Average replication timing T50 profiles are in think black lines. Efficiency is indicated by T0 and T100 profiles at individual loci in grey lines. Approximately 39 origins that have been validated by 2D-gel electrophoresis are marked with vertical lines. Predicted origins and AT-rich islands are indicated in blue and purple dots on the top of the profiles, respectively. Horizontal orange and green lines at the bottom of the profiles indicate efficient and inefficient subchromosomal regions, respectively. Solid red circles and triangles indicate centromeres and telomeres. No adjacent telomeres indicated in chromosome III due to the presence of multiple arrays of large rDNA sequences at the ends.
Figure 4
Figure 4. Characteristics of DNA replication timing T50 and efficiency η at various loci in wild type cells released after HU block.
Box plot indicates the non-outliers minimum (left end of the line), the lower quartile (left end of the rectangle), median (centre of the rectangle), the upper quartile (right end of the rectangle), and the non-outlier maximum (right end of the line). (A) The box-plots of T50 distribution of individual loci of the genome and individual chromosomes as indicated. The T50-median of the loci of the genome or individual chromosomes is presented in parentheses. (B) The box-plots of T50 distribution of efficient and inefficient loci. Efficient and inefficient loci are those whose η is greater and less than the η-median, respectively. The T50-median of efficient and inefficient loci is indicated in parentheses. (C) Numbers of loci in the binned ΔT series or η series. (D) Plot of efficiency η versus average replication timing T50 of individual loci. Only ∼0.3% (16 out of 4733) loci of the genome exhibited their efficiency η of greater than 1 (or duplicating the DNA in less than 10 min). The arrow indicates the asymmetric distribution of the T50. (E–G) The T50 distribution of loci and the number of loci in the binned η series in chromosome I (E), II (F), and III (G). It is displayed as described in (B) and (C). (H) The plot of T50 versus η or ΔT of efficient and inefficient regions. X- and Y-axis indicate T50 and η or ΔT, respectively. The efficient and inefficient regions are indicated by closed and open circles, respectively.
Figure 5
Figure 5. Characteristics of average firing timing T50 and (maximum) firing efficiency η at various predicted origins in wild type cells released after HU block.
(A) The box-plots of T50 distribution of predicted origins of the genome and individual chromosomes as indicated. The T50-median of the origins of the genome or individual chromosomes is presented in parentheses. (B) The box-plots of T50 distribution of efficient and inefficient origins. Efficient and inefficient origins are those whose η is greater and less than the η-median, respectively. The T50-median of efficient and inefficient origins is indicated in parentheses. (C) Plot of firing efficiency η versus average firing timing T50 of individual origins. The arrow indicates the asymmetric distribution of the T50. (D) The Venn diagram of predicted peaks and loci containing HU-induced ssDNA deposit. (E) The over-representation of ssDNA in predicated origins of chromosome III. Numbers of the predicated origins/peaks and those overlapped with the loci containing ssDNA deposit are indicated. The asterisk indicates the significant enrichment of ssDNA in chromosome III.
Figure 6
Figure 6. Global DNA replication profiles of HU-challenged cds1Δ cells.
The profiles are displayed as described in Figure 3.
Figure 7
Figure 7. Characteristics of DNA replication timing T50 and efficiency η at various loci in cds1Δ cells released after HU block.
(A) The box-plots of T50 distribution of individual loci of the genome and individual chromosomes in cds1Δ cells as indicated. The T50-median of the loci of the genome or individual chromosomes is presented in parentheses. (B) The box-plots of T50 distribution of efficient and inefficient loci in cds1Δ cells. (C) Numbers of loci in the binned ΔT series or η series. (D) Plot of efficiency η versus average replication timing T50 of individual loci in cds1Δ cells. Less than ∼0.1% (3 out of 4787) loci of the genome exhibited their efficiency η of greater than 1 (or duplicating the DNA in less than 40 min). The arrow indicates the asymmetric distribution of the T50. (E) The plot of T50 versus η or ΔT of efficient and inefficient regions in cds1Δ cells. X- and Y-axis indicate T50 and η or ΔT, respectively. The efficient and inefficient regions are indicated by closed and open circles, respectively.
Figure 8
Figure 8. Characteristics of average firing timing T50 and (maximum) firing efficiency η at various predicted origins in cds1Δ cells released after HU block.
(A) The box-plots of T50 distribution of predicted origins of the genome and individual chromosomes cds1Δ cells as indicated. The T50-median of the origins of the genome or individual chromosomes is presented in parentheses. (B) The box-plots of T50 distribution of efficient and inefficient origins cds1Δ cells. The T50-median of efficient and inefficient origins is indicated in parentheses. (C) Plot of firing efficiency η versus average firing timing T50 of individual origins cds1Δ cells. The arrow indicates the asymmetric distribution of the T50. (D) Venn diagram of peaks predicted in wild type and cds1Δ cells. Overlapping peaks are those whose distance is less than 12 Kb. (E) The T50 distribution of the wild type-unique and overlapping origins in wild type cells. The asterisk indicates the significant increase in firing efficiency of the wild type-unique origins. (F) The T50 distribution of the cds1-unique and overlapping origins in cds1Δ cells.

References

    1. Gilbert DM. Nuclear position leaves its mark on replication timing. J Cell Biol. 2001;152:F11–15. - PMC - PubMed
    1. MacAlpine DM, Bell SP. A genomic view of eukaryotic DNA replication. Chromosome Res. 2005;13:309–326. - PubMed
    1. Bell SP, Dutta A. DNA replication in eukaryotic cells. Annu Rev Biochem. 2002;71:333–374. - PubMed
    1. Raghuraman MK, Winzeler EA, Collingwood D, Hunt S, Wodicka L, et al. Replication dynamics of the yeast genome. Science. 2001;294:115–121. - PubMed
    1. Schubeler D, Scalzo D, Kooperberg C, van Steensel B, Delrow J, et al. Genome-wide DNA replication profile for Drosophila melanogaster: a link between transcription and replication timing. Nat Genet. 2002;32:438–442. - PubMed

Publication types

MeSH terms

Substances