

Noninvasive imaging of cardiac electrophysiology
Affiliations
- PMID: 17684574
- PMCID: PMC1939868
Item in Clipboard
Noninvasive imaging of cardiac electrophysiology
Indian Pacing Electrophysiol J.
.
Abstract
Noninvasive imaging of cardiac electrophysiology is still a major goal despite all recent technical innovations. This review gives an overview about the historical background, recent developments and possible future applications of noninvasive imaging of cardiac electrophysiology.
Figures

The left panel shows a MRI cardiac short axis scan (slice thickness 6mm). The middle panel shows a triangulated and remeshed surface model of individual cardiac anatomy (LV=left ventricle; RV=right ventricle; RVOT=right ventricular outflow tract). The right panel shows the fusion of MRI data and the individual cardiac model. (Figure modified from Berger T et al, Single-beat noninvasive imaging of cardiac electrophysiology of ventricular pre-excitation. J Am Coll Cardiol 2006; 48: 2045-52. with permission. Copyright Elsevier, American College of Cardiology, 2006)

Localization of the 65-leads on the chest surface as used for the NICE approach. (Figure modified from Berger T et al, Single-beat noninvasive imaging of cardiac electrophysiology of ventricular pre-excitation. J Am Coll Cardiol 2006; 48: 2045-52. with permission. Copyright Elsevier, American College of Cardiology, 2006)

Workflow of NICE
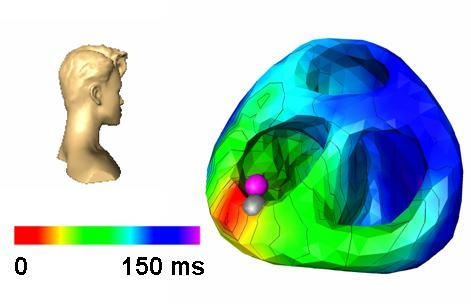
The areas of first onset of ventricular activation are indicated by red colour, the areas of latest activation are indicated by blue colour, as obtained by NICE. Here, preexcitation is indicated by early ventricular activation (red area) in a patient with a left posterolateral accessory pathway. The ablation points (grey markers) and the location of successful ablation (purple marker) indicating the ventricular insertion site of the accessory pathway, as obtained by CARTO™. Head icons indicate point of view. Isochrones are plotted in 20 ms intervals. (Figure modified from Berger T et al, Single-beat noninvasive imaging of cardiac electrophysiology of ventricular pre-excitation. J Am Coll Cardiol 2006; 48: 2045-52. with permission. Copyright Elsevier, American College of Cardiology, 2006)
Similar articles
-
Applications of Cardiac MR Imaging in Electrophysiology: Current Status and Future Needs.Magn Reson Imaging Clin N Am. 2019 Aug;27(3):465-473. doi: 10.1016/j.mric.2019.04.006. Magn Reson Imaging Clin N Am. 2019. PMID: 31279450 Review.
-
Applications of computed tomography in clinical cardiac electrophysiology.J Cardiovasc Comput Tomogr. 2007 Dec;1(3):131-42. doi: 10.1016/j.jcct.2007.09.001. Epub 2007 Sep 29. J Cardiovasc Comput Tomogr. 2007. PMID: 19083897 Review.
-
Challenges facing validation of noninvasive electrical imaging of the heart.Ann Noninvasive Electrocardiol. 2005 Jan;10(1):73-82. doi: 10.1111/j.1542-474X.2005.00608.x. Ann Noninvasive Electrocardiol. 2005. PMID: 15649241 Free PMC article. Review.
-
Machine-readable Yin-Yang imbalance: traditional Chinese medicine syndrome computer modeling based on three-dimensional noninvasive cardiac electrophysiology imaging.J Int Med Res. 2019 Apr;47(4):1580-1591. doi: 10.1177/0300060518824247. Epub 2019 Mar 5. J Int Med Res. 2019. PMID: 30832524 Free PMC article.
-
Noninvasive imaging of cardiac electrophysiology and arrhythmia.Ann N Y Acad Sci. 2010 Feb;1188:214-21. doi: 10.1111/j.1749-6632.2009.05103.x. Ann N Y Acad Sci. 2010. PMID: 20201906
Cited by
-
Noninvasive imaging of cardiac excitation: current status and future perspective.Ann Noninvasive Electrocardiol. 2014 Mar;19(2):105-13. doi: 10.1111/anec.12140. Epub 2014 Feb 19. Ann Noninvasive Electrocardiol. 2014. PMID: 24620843 Free PMC article. Review.
References
-
- Taccardi B, Punske BB, Lux RL, et al. Useful lessons from body surface mapping. J Cardiovasc Electrophysiol. 1998;9:773–786. - PubMed
-
- Potse M, Linnenbank AC, Peeters HA, et al. Continous localization of cardiac activation sites using a database of multichannel ECG recordings. IEEE Trans Biomed Eng. 2000;47:682–689. - PubMed
-
- Hoekema R, Uijen GJ, van Oosterom A, et al. On selecting a body surface mapping procedure. J Electrocardiol. 1999;32:93–101. - PubMed
-
- Hoekema R, Uijen G, van Oosterom A. The number of independent signals in body surface maps. Methods Inf Med. 1999;38:119–124. - PubMed
-
- Taccardi B, Macchi E, Lux RL, et al. Effect of myocardial fiber direction on epicardial potentials. Circulation. 1994;90:3076–3090. - PubMed
LinkOut - more resources
Full Text Sources