

Transmission-blocking activity induced by malaria vaccine candidates Pfs25/Pvs25 is a direct and predictable function of antibody titer
- PMID: 17686163
- PMCID: PMC1971714
- DOI: 10.1186/1475-2875-6-107
Transmission-blocking activity induced by malaria vaccine candidates Pfs25/Pvs25 is a direct and predictable function of antibody titer
Abstract
Background: Mosquito stage malaria vaccines are designed to induce an immune response in the human host that will block the parasite's growth in the mosquito and consequently block transmission of the parasite. A mosquito membrane-feeding assay (MFA) is used to test transmission-blocking activity (TBA), but in this technique cannot accommodate many samples. A clear understanding of the relationship between antibody levels and TBA may allow ELISA determinations to be used to predict TBA and assist in planning vaccine development.
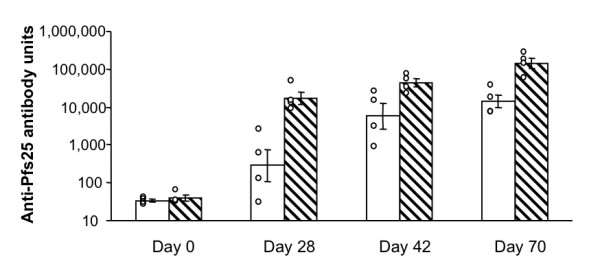
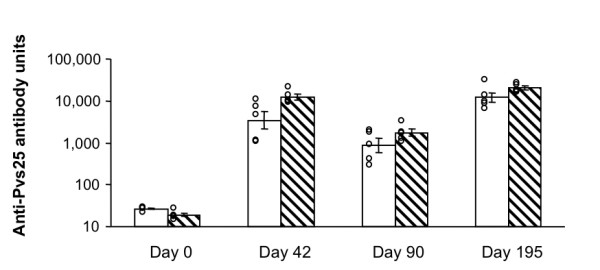
Methods: Rabbit anti-Pfs25 sera and monkey anti-Pvs25 sera were generated and the antibody titers were determined by a standardized ELISA. The biological activity of the same sera was tested by MFA using Plasmodium gametocytes (cultured Plasmodium falciparum or Plasmodium vivax from malaria patients) and Anopheles mosquitoes.
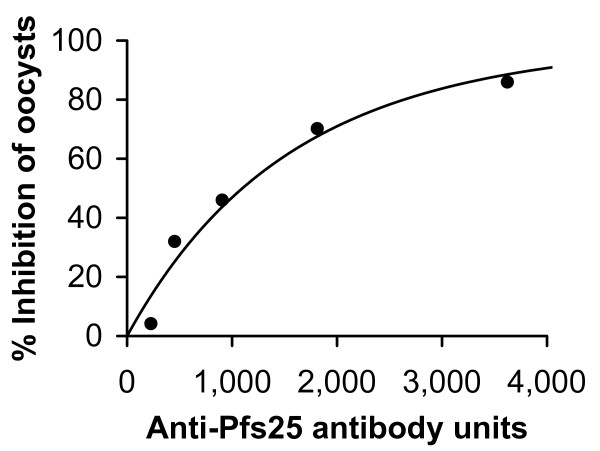
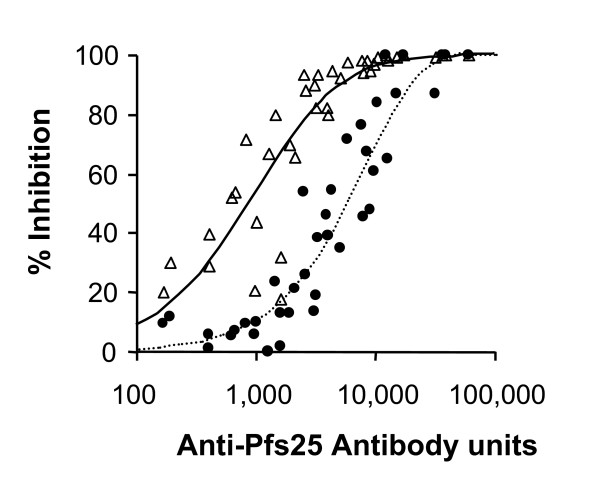
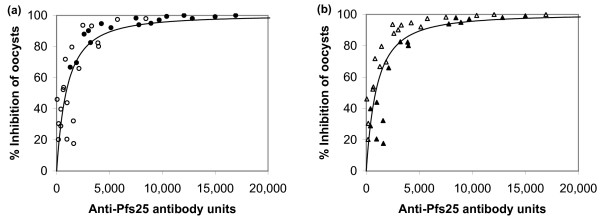
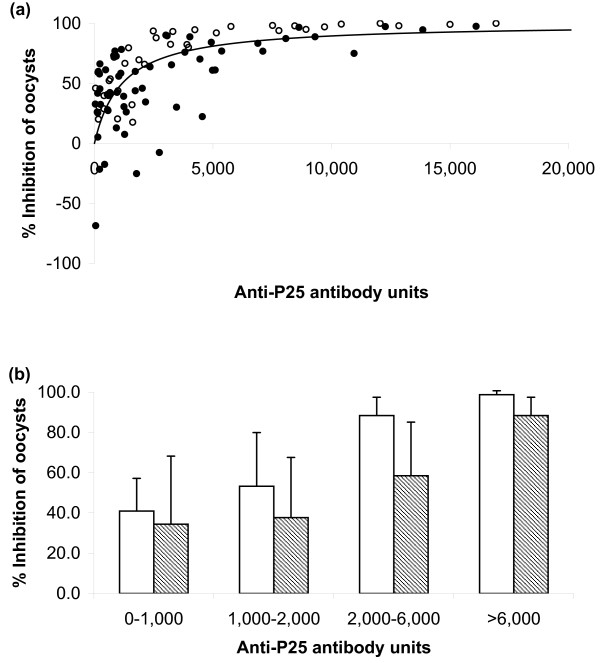
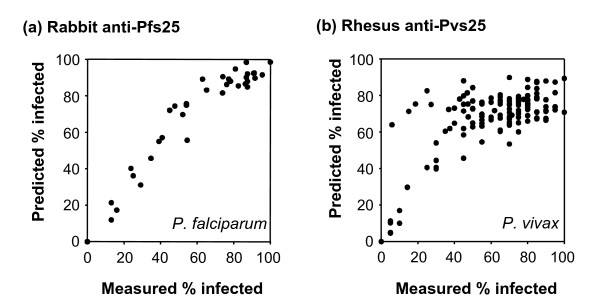
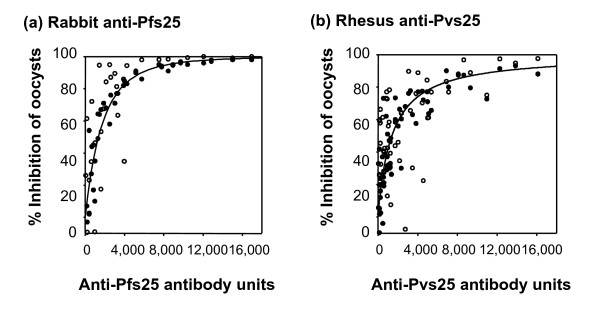
Results: Anti-Pfs25 and anti-Pvs25 sera showed that ELISA antibody units correlate with the percent reduction in the oocyst density per mosquito (Spearman Rank correlations: 0.934 and 0.616, respectively), and fit a hyperbolic curve when percent reduction in oocyst density is plotted against antibody units of the tested sample. Antibody levels also correlated with the number of mosquitoes that failed to become infected, and this proportion can be calculated from the reduction in oocyst numbers and the distribution of oocysts per infected mosquito in control group.
Conclusion: ELISA data may be used as a surrogate for the MFA to evaluate transmission-blocking vaccine efficacy. This will facilitate the evaluation of transmission-blocking vaccines and implementation of this malaria control strategy.
Figures
Similar articles
-
Evaluation of combination vaccines targeting transmission of Plasmodium falciparum and P. vivax.Vaccine. 2024 Aug 30;42(21):126140. doi: 10.1016/j.vaccine.2024.07.041. Epub 2024 Jul 20. Vaccine. 2024. PMID: 39033079
-
Nasal immunization with a malaria transmission-blocking vaccine candidate, Pfs25, induces complete protective immunity in mice against field isolates of Plasmodium falciparum.Infect Immun. 2005 Nov;73(11):7375-80. doi: 10.1128/IAI.73.11.7375-7380.2005. Infect Immun. 2005. PMID: 16239536 Free PMC article.
-
Phase 1 trial of malaria transmission blocking vaccine candidates Pfs25 and Pvs25 formulated with montanide ISA 51.PLoS One. 2008 Jul 9;3(7):e2636. doi: 10.1371/journal.pone.0002636. PLoS One. 2008. PMID: 18612426 Free PMC article. Clinical Trial.
-
Transmission-Blocking Vaccines: Harnessing Herd Immunity for Malaria Elimination.Expert Rev Vaccines. 2021 Feb;20(2):185-198. doi: 10.1080/14760584.2021.1878028. Epub 2021 Jan 31. Expert Rev Vaccines. 2021. PMID: 33478283 Free PMC article. Review.
-
Transmission-blocking vaccine of vivax malaria.Parasitol Int. 2003 Mar;52(1):1-11. doi: 10.1016/s1383-5769(02)00037-5. Parasitol Int. 2003. PMID: 12543142 Review.
Cited by
-
Population biology of malaria within the mosquito: density-dependent processes and potential implications for transmission-blocking interventions.Malar J. 2010 Nov 4;9:311. doi: 10.1186/1475-2875-9-311. Malar J. 2010. PMID: 21050427 Free PMC article.
-
Evaluation of the Pfs25-IMX313/Matrix-M malaria transmission-blocking candidate vaccine in endemic settings.Malar J. 2022 Jun 2;21(1):159. doi: 10.1186/s12936-022-04173-y. Malar J. 2022. PMID: 35655174 Free PMC article. Review.
-
Acquired immunity to malaria.Clin Microbiol Rev. 2009 Jan;22(1):13-36, Table of Contents. doi: 10.1128/CMR.00025-08. Clin Microbiol Rev. 2009. PMID: 19136431 Free PMC article. Review.
-
Naturally Acquired Antibody Responses to a Synthetic Malaria Antigen AS202.11.J Trop Med. 2017;2017:6843701. doi: 10.1155/2017/6843701. Epub 2017 Sep 12. J Trop Med. 2017. PMID: 29138641 Free PMC article.
-
A review of malaria vaccine clinical projects based on the WHO rainbow table.Malar J. 2012 Jan 9;11:11. doi: 10.1186/1475-2875-11-11. Malar J. 2012. PMID: 22230255 Free PMC article. Review.
References
-
- Ballou WR, Arevalo-Herrera M, Carucci D, Richie TL, Corradin G, Diggs C, Druilhe P, Giersing BK, Saul A, Heppner DG, Kester KE, Lanar DE, Lyon J, Hill AV, Pan W, Cohen JD. Update on the clinical development of candidate malaria vaccines. Am J Trop Med Hyg. 2004;71:239–247. - PubMed
-
- Alonso PL, Sacarlal J, Aponte JJ, Leach A, Macete E, Aide P, Sigauque B, Milman J, Mandomando I, Bassat Q, Guinovart C, Espasa M, Corachan S, Lievens M, Navia MM, Dubois MC, Menendez C, Dubovsky F, Cohen J, Thompson R, Ballou WR. Duration of protection with RTS,S/AS02A malaria vaccine in prevention of Plasmodium falciparum disease in Mozambican children: single-blind extended follow-up of a randomised controlled trial. Lancet. 2005;366:2012–2018. doi: 10.1016/S0140-6736(05)67669-6. - DOI - PubMed
Publication types
MeSH terms
Substances
Grants and funding
LinkOut - more resources
Full Text Sources
Other Literature Sources
Medical
