. 2007 Sep 12:1169:98-111.
doi: 10.1016/j.brainres.2007.07.010. Epub 2007 Jul 14.

Evidence for differential changes of junctional complex proteins in murine neurocysticercosis dependent upon CNS vasculature

Affiliations

Evidence for differential changes of junctional complex proteins in murine neurocysticercosis dependent upon CNS vasculature

Jorge I Alvarez et al. Brain Res. .

Abstract

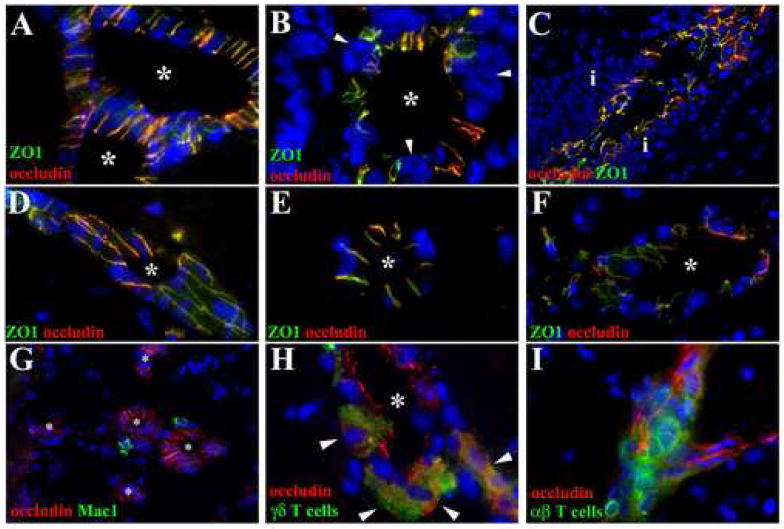
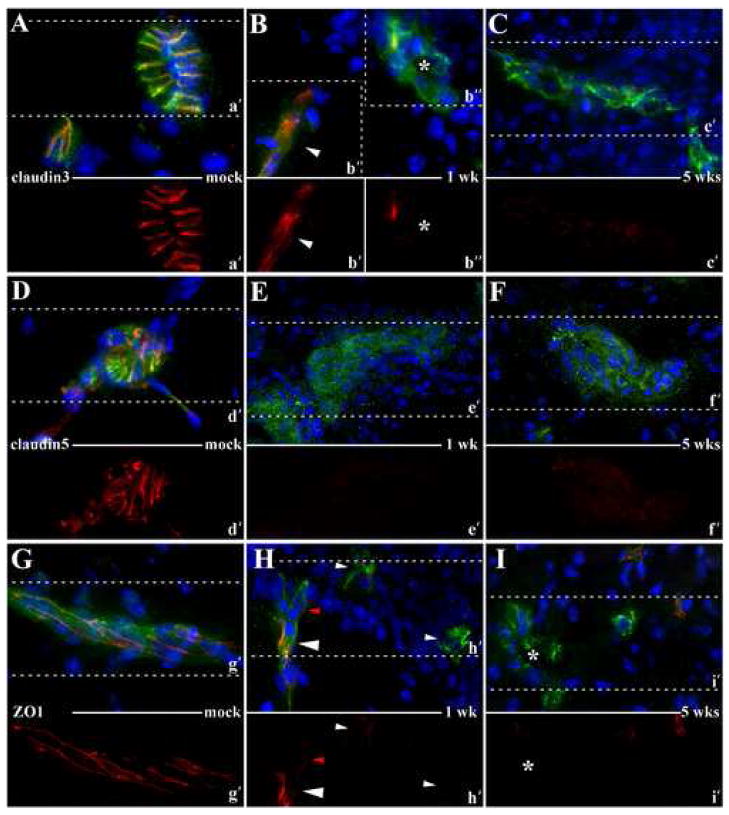
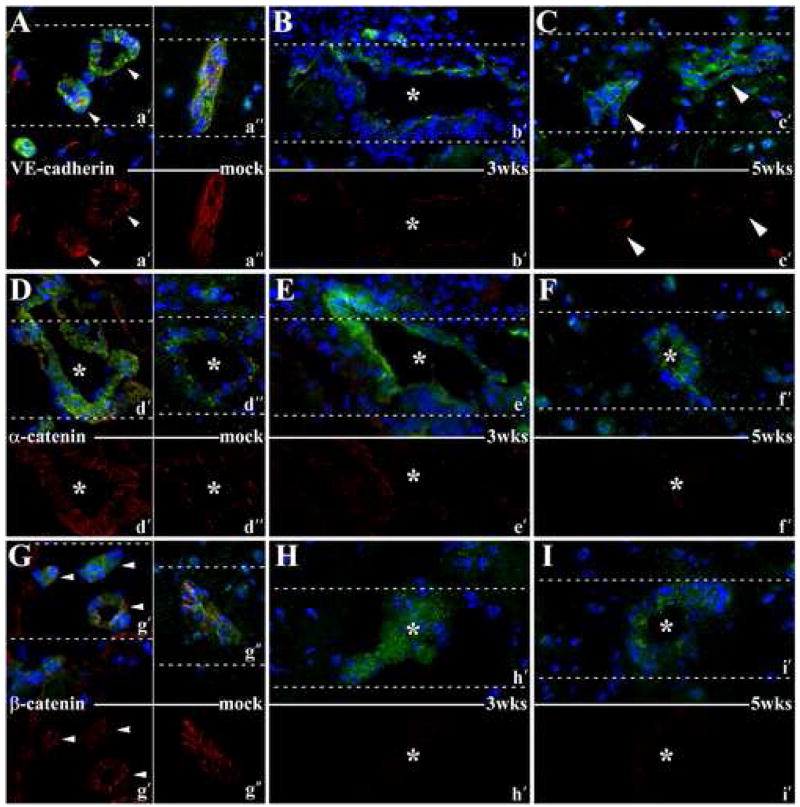
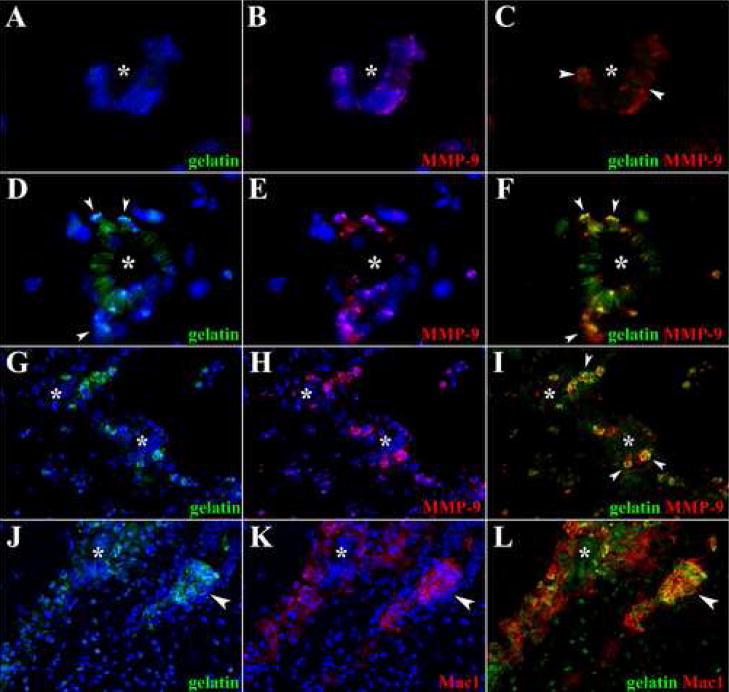
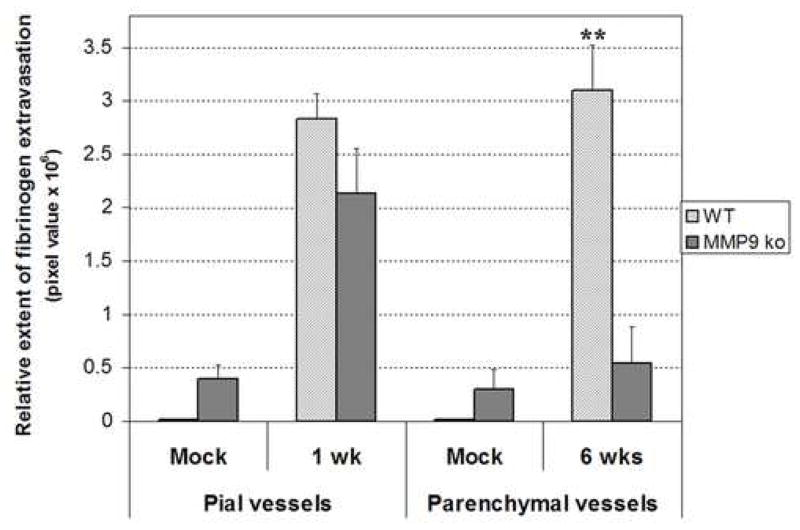
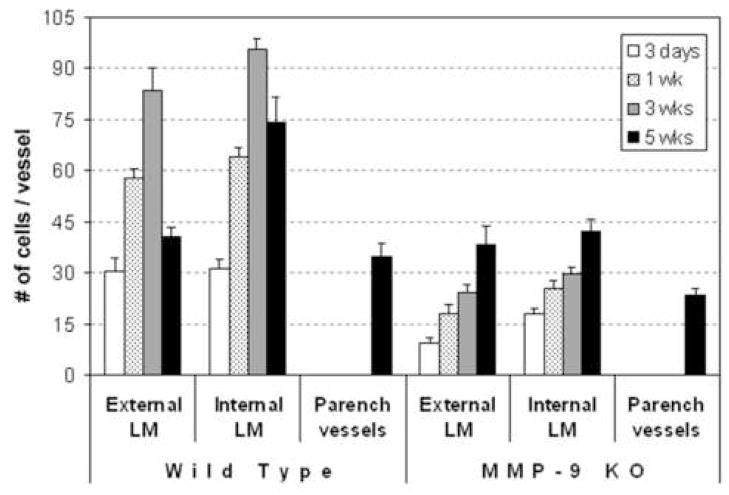
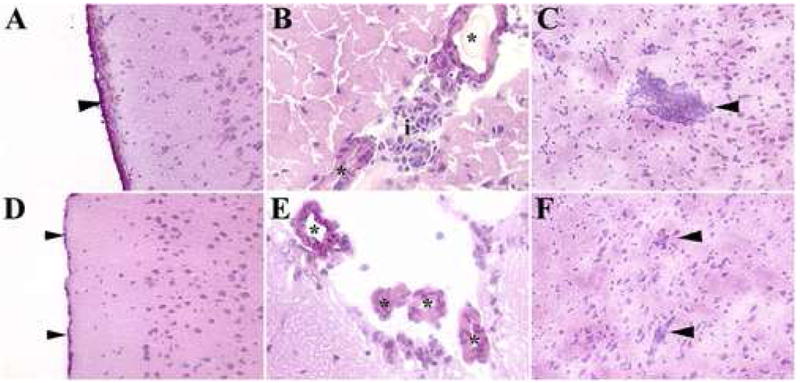
The delicate balance required to maintain homeostasis of the central nervous system (CNS) is controlled by the blood-brain barrier (BBB). Upon injury, the BBB is disrupted compromising the CNS. BBB disruption has been represented as a uniform event. However, our group has shown in a murine model of neurocysticercosis (NCC) that BBB disruption varies depending upon the anatomical site/vascular bed analyzed. In this study further understanding of the mechanisms of BBB disruption was explored in blood vessels located in leptomeninges (pial vessels) and brain parenchyma (parenchymal vessels) by examining the expression of junctional complex proteins in murine brain infected with Mesocestoides corti. Both pial and parenchymal vessels from mock infected animals showed significant colocalization of junctional proteins and displayed an organized architecture. Upon infection, the patterned organization was disrupted and in some cases, particular tight junction and adherens junction proteins were undetectable or appeared to be undergoing proteolysis. The extent and timing of these changes differed between both types of vessels (pial vessel disruption within days versus weeks for parenchymal vessels). To approach potential mechanisms, the expression and activity of matrix metalloproteinase-9 (MMP-9) were evaluated by in situ zymography. The results indicated an increase in MMP-9 activity at sites of BBB disruption exhibiting leukocyte infiltration. Moreover, the timing of MMP activity in pial and parenchymal vessels correlated with the timing of permeability disruption. Thus, breakdown of the BBB is a mutable process despite the similar structure of the junctional complex between pial and parenchymal vessels and involvement of MMP activity.


Figures

Figure 1
Figure 1. Kinetics of TJ protein expression changes in pial and parenchymal vessels during murine NCC
Nuclei are stained blue with DAPI. ZO1 (Fig 1A–F) and leukocyte suptypes (Fig 1G–I) are shown in green (Alexa 488). Occludin is shown in red (Rhodamine red X). (A) Parallel organization of TJs in pial vessels (asterisks) of mock infected animal. X1000 (B) Disruption of TJ architecture in pial vessel of 1 day infected animal. Arrowheads indicate cells migrating through the vessel. X1000 (C) Massive leukocyte migration, perivascular infiltrates (i) and disruption of TJ architecture in pial vessel of 3 wk infected animal. X400 (D) Alignment of TJ proteins in parenchymal vessel (asterisk) of mock infected animal. X1000 (E) Expression and morphology of TJ proteins remain intact in parenchymal vessel (asterisk) of 3 wk infected animal. X1000 (F) Disruption of TJs in parenchymal vessel (asterisk) after 5 wk of infection. X1000 (G) Occludin expression showing parallel organization in junctional complexes of pial vessels (asterisks). Perivascular macrophages (green) are found in vicinity of the vessels. Mock infected animal. X400 (H) Disruption of TJ architecture shown by occludin staining in pial vessel of 1 wk infected animal. Arrowheads represent γδ T cells (green) migrating through the vessel. X1000 (I) Migration of αβ T cells (green) through parenchymal vessel that displayed disrupted expression of occludin. 5 wks after infection. X1000
Figure 2
Figure 2. Downregulation/degradation of TJ proteins in murine NCC
Nuclei are stained blue with DAPI. JAM-A is shown in green (Alexa 488) and claudin-3 (A to C), claudin-5 (D to F) and ZO1 (G to H) in red (Rhodamine red X). For each image a portion of it; demarcated by dotted lines and labeled a′, b′, b″, c′, etc is shown below in which only claudin-3, claudin-5 and ZO1 are included so that changes in expression can be more easily observed (in red). (A) Claudin-3 and JAM-A expression in the junctional complexes of pial vessels in a mock infected animal. X400 (B) Claudin-3 and JAM-A colocalize in parenchymal vessel (arrowhead), but claudin-3 expression is almost undetectable in pial vessel (asterisk) after 1 wk of infection (b″). X1000 (C) Parenchymal vessel of 5 wk infected animal expressing JAM-A; low to undetectable levels of claudin-3 are detected (c′). X1000 (D) Claudin-5 and JAM-A expression in parenchymal vessel of mock infected animal. X400 (E) JAM-A, but no claudin-5 (e′) is detected in an inflammed pial vessel after 3 wks of infection. X630 (F) Parenchymal vessel of 5 wk infected animal expressing JAM-A; disrupted and low expression of claudin-5 (f′) is detected. X630 (G) ZO1 and JAM-A expression in parenchymal vessel of mock infected animal. X1000 (H) ZO-1 expression is low and undetectable in pial vessels (small arrowheads). A parenchymal vessel (large arrowhead) in the vicinity shows low ZO1 expression in area (red arrowhead) close to the subarachnoid space. JAM-A is detected in all the vessels. 1 wk post-infection. X630 (I) ZO1 expression is lost in parenchymal vessel (asterisk) after 5 wks of infection (i′). X630
Figure 3
Figure 3. Changes in the expression of AJ proteins during the course of murine NCC
Blue represents the nuclei stained with DAPI. JAM-A is represented in green (Alexa 488) and VE-cadherin (A to C), α-catenin (D to F) and β-catenin (G to H) in red (Rhodamine red X). For each picture a section (between dashed lines and labeled a′, b′, etc) only showing the AJ proteins was included to better appreciate changes in expression during infection. All pictures were taken with a 63X objective (A) VE-cadherin and JAM-A expression in pial (arrowheads) and parenchymal vessels of mock infected animal (B) Disruption and loss of VE-cadherin in junctional complexes of pial vessel (asterisk) after 3 wks of infection (b′) (C) Parenchymal vessels (arrowheads) of 5 wk infected animal stained with JAM-A; low to undetectable levels of VE-cadherin are found (c′) (D) α-catenin and JAM-A expression in pial and parenchymal vessels (asterisks) of mock infected animal α (E) Disruption and loss of α-catenin (e′) in pial vessel (asterisk) of 3 wk infected animal. JAM-A is present in the vessel (F) Disruption of the TJ architecture accompanied of low to undetectable levels of α-catenin (f′) in parenchymal vessel (asterisk) of 5 wk infected animal (G) β-catenin and JAM-A expression in pial (arrowheads) and parenchymal vessels (asterisks) of mock infected animal (H) Pial vessel (asterisk) of 3 wk infected animal showing low to undetectable expression of β-catenin (h′) (I) Parenchymal vessel (asterisk) of 5 wk infected animal expressing low to undetectable levels of β-catenin (i′).
Figure 4
Figure 4. Expression and activity of MMP-9 in pial and parenchymal vessels at different post-infection times
Enzymatic activity of MMPs is visualized by in situ proteolysis of gelatin conjugated with Alexa 488 (green). MMP-9 and inflammatory cells were detected using antibodies conjugated with rhodamine red X (red). Nuclei were stained with DAPI (blue). DAPI staining was excluded in C, F, I and L for clarity (A) Pial vessel (asterisk) displaying minimal gelatinolysis in mock infected animal. X1000 (B) Same field as A showing low expression of MMP-9 in cells associated with pial vessel (asterisk) (C) Merged image of A and B showing very low expression of active MMP-9 in cells (arrowheads) extravasating pial vessel (asterisk) (D) Pial vessel (asterisk) with extravasating cells (arrowheads) showing polarized gelatinolysis from the lumen towards the basal lamina and the perivascular area. 1 day infected animal. X1000 (E) Same field as A, but showing MMP-9 expression in extravasating cells (F) Merged image of D and E. MMP-9 expression (red) and gelatinolysis (green) is seen in cells (arrowheads) infiltrating into leptomeninges through a pial vessel (asterisk) (G) Increase of gelatinolytic activity in cells extravasating pial vessels (asterisks) after 1 wk of infection. X400 (H) Same field as G showing MMP-9 expression (I) Merged image of G and H. Gelatinolysis (green) and MMP-9 expression (red) increase in cells (arrows) extravasating pial vessels (asterisks) (J) Gelatinolytic activity in cells infiltrating in the periphery of pial (asterisk) and parenchymal (arrow) vessels after 5 wks of infection. X400 (K) Same field as G, showing Mac1+ cells (CD11b) (L) Merged image of J and K. Gelatinolysis in Mac1+ cells infiltrating through pial vessel (asterisk) and parenchymal vessel (arrow).
Figure 5
Figure 5. Measure of BBB permeability in pial and parenchymal vessels of wild type and MMP-9−/− animals
Quantitative analysis of fibrinogen extravasation in both genotypes was done in pial (1 wk) and parenchymal vessels (6 wks) of mock and M. corti infected animals (n = 5). The relative levels of fibrinogen extravasation were calculated as described in Experimental Procedures. The extent of fibrinogen extravasation was higher in pial and parenchymal vessels of mock infected MMP-9−/− mice compared to wt. Upon infection, the extent of fibrinogen measured outside of vessels was higher in wild type than MMP-9−/− animals, particularly in parenchymal vessels (p<0.01). Error bar: standard error of the mean (SEM). The data obtained was compared using a student’s t-test.
Figure 6
Figure 6. Infiltrating leukocytes in perivascular space of vessels located in leptomeninges and parenchyma of wild type and MMP-9−/− animals infected with M. corti
Semiquantitative analysis of cellular infiltrates was done by counting the number of leukocytes perivascular to pial vessels in both the external and internal leptomeninges and parenchymal vessels (n = 12 vessels per analyzed area) at different post-infection times. With the exception of the occasional perivascular macrophages normally present in pial and parenchymal vessels of mock infected mice (Fig 1G), the number of perivascular leukocytes in these animals is essentially zero as multiple sections needed to be screened to find 1 or 2 leukocytes by fluorescent staining for specific immune cell subsets. Error bar: standard error of the mean (SEM), the number of cells in the perivascular infiltrates of both type of vessels is statistically different comparing wild type and MMP-9 deficient mice in the distinct post-infection times, P < 0.05 (paired t-test). LM: leptomeninges, Parench: parenchymal.
Figure 7
Figure 7. Leukocyte infiltration in wild type and MMP-9−/− mice
H&E staining of mouse brain sections at different post-infection times. A to C are samples from wild type mice and D to F are from the MMP-9−/− phenotype (A) Leukocyte infiltrates (arrowhead) in external leptomeninges. Wild type – 1 wk, X200 (B) Leukocyte infiltrate (i) in periphery of pial vessels (asterisks) located in internal leptomeninges. Wild type – 3 wk, X400 (C) Massive leukocyte infiltration (arrowhead) around parenchymal vessel. Wild type – 5 wk, X200 (D) External leptomeninges (arrowheads) without apparent leukocyte infiltration. MMP-9−/− – 1 wk, X200 (E) Scarce leukocyte infiltration in periphery of pial vessels (asterisks) located in internal leptomeninges. MMP-9−/− – 3wk, X400 (F) Low perivascular infiltration (arrowheads) in parenchymal vessels. MMP-9−/− – 5wk, X200.

Similar articles

Cited by

References

    1. Allt G, Lawrenson JG. Is the pial microvessel a good model for blood-brain barrier studies? Brain Res Brain Res Rev. 1997;24:67–76. - PubMed
    1. Alvarez JI, Teale JM. Breakdown of the blood brain barrier and blood-cerebrospinal fluid barrier is associated with differential leukocyte migration in distinct compartments of the CNS during the course of murine NCC. J Neuroimmunol. 2006;173:45–55. - PubMed
    1. Andras IE, Pu H, Deli MA, Nath A, Hennig B, Toborek M. HIV-1 Tat protein alters tight junction protein expression and distribution in cultured brain endothelial cells. J Neurosci Res. 2003;74:255–65. - PubMed
    1. Asahi M, Wang X, Mori T, Sumii T, Jung JC, Moskowitz MA, Fini ME, Lo EH. Effects of matrix metalloproteinase-9 gene knock-out on the proteolysis of blood-brain barrier and white matter components after cerebral ischemia. J Neurosci. 2001;21:7724–32. - PMC - PubMed
    1. Aurrand-Lions M, Johnson-Leger C, Wong C, Du Pasquier L, Imhof BA. Heterogeneity of endothelial junctions is reflected by differential expression and specific subcellular localization of the three JAM family members. Blood. 2001;98:3699–707. - PubMed

Publication types

MeSH terms

Substances