. 2007;35(15):e99.
doi: 10.1093/nar/gkm549. Epub 2007 Aug 7.

Toward a universal microarray: prediction of gene expression through nearest-neighbor probe sequence identification

Affiliations

Toward a universal microarray: prediction of gene expression through nearest-neighbor probe sequence identification

Thomas E Royce et al. Nucleic Acids Res. 2007.

Abstract

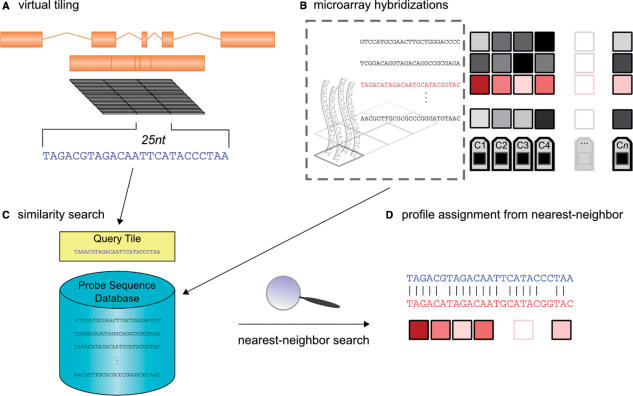
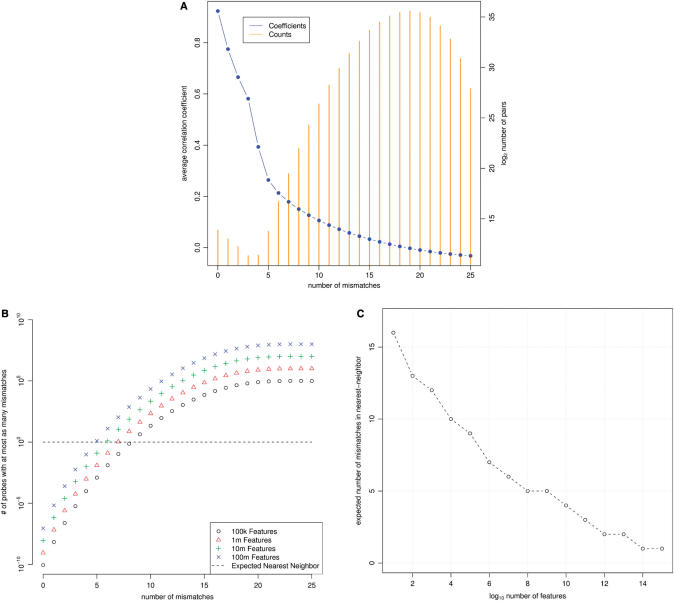
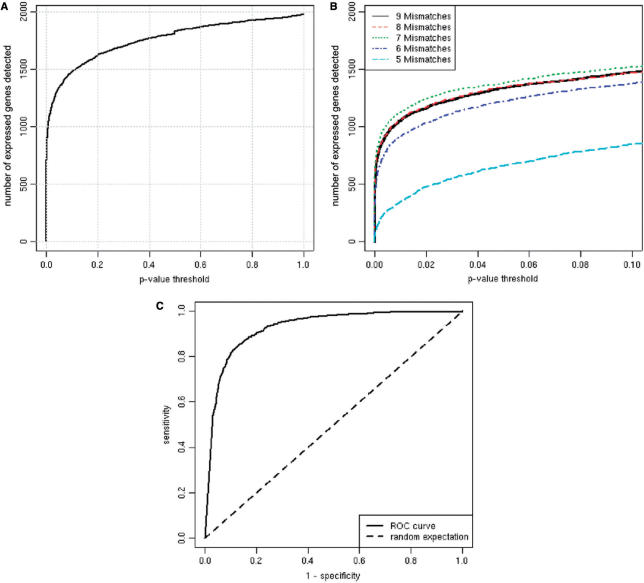
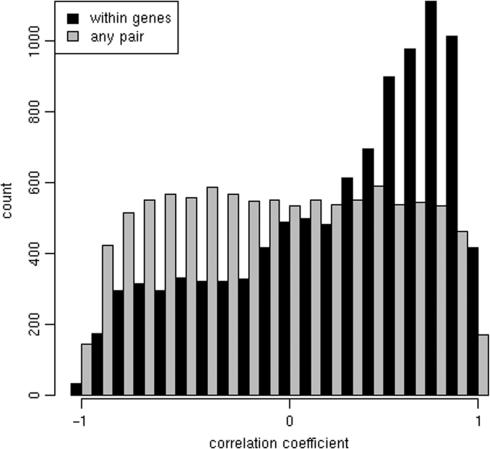
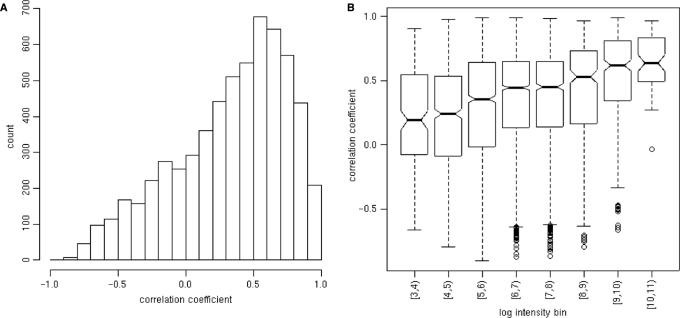
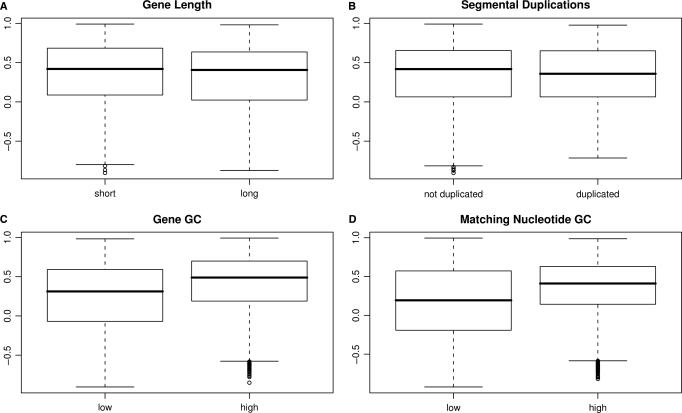
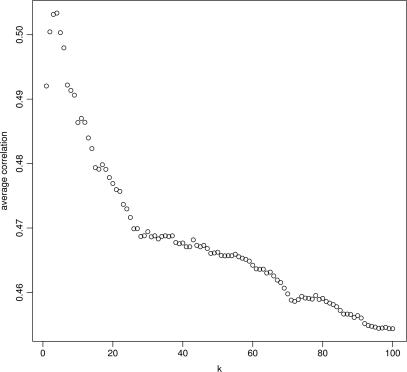
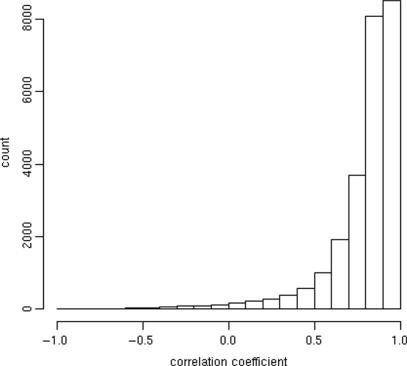
A generic DNA microarray design applicable to any species would greatly benefit comparative genomics. We have addressed the feasibility of such a design by leveraging the great feature densities and relatively unbiased nature of genomic tiling microarrays. Specifically, we first divided each Homo sapiens Refseq-derived gene's spliced nucleotide sequence into all of its possible contiguous 25 nt subsequences. For each of these 25 nt subsequences, we searched a recent human transcript mapping experiment's probe design for the 25 nt probe sequence having the fewest mismatches with the subsequence, but that did not match the subsequence exactly. Signal intensities measured with each gene's nearest-neighbor features were subsequently averaged to predict their gene expression levels in each of the experiment's thirty-three hybridizations. We examined the fidelity of this approach in terms of both sensitivity and specificity for detecting actively transcribed genes, for transcriptional consistency between exons of the same gene, and for reproducibility between tiling array designs. Taken together, our results provide proof-of-principle for probing nucleic acid targets with off-target, nearest-neighbor features.


Figures

Figure 1.
Figure 1.
Outline of nearest-neighbor microarray analysis. (A) A gene with several exons is merged into a single transcriptional unit, from which all 25nt tiles are extracted. (B) In parallel, a database is constructed such that each entry represents a single feature's expression profile across n cell types and/or conditions, C1, … Cn. Each of these entries is indexed by its feature's probe sequence. (C) For each query tile, a nearest-neighbor query is performed against this database. (D) When the nearest-neighbor probe is found, its expression profile is assigned to the query tile.
Figure 2.
Figure 2.
Properties of the nearest-neighbor strategy. (A) Feature pairs with several mismatches are weak predictors of signal. All possible pairs of features from a single tiling microarray design were analyzed. The average correlation coefficients (blue circles, left axis) and number of pairs contributing to those averages (orange bars, right axis) are plotted for all possible number of mismatches. (B) Expected number of mismatches between a tile and its nearest-neighbor probe sequence. For a number of mismatches, k, the expected number of features having k or fewer mismatches to any 25nt tile is plotted. These expectations are plotted for array designs having 105, 106, 107 and 108 features. The value of k for which a series crosses unity on the y-axis represents the expected number of mismatches between a tile and its nearest-neighbor probe sequence. (C) Detail of this cross-section.
Figure 3.
Figure 3.
Many genes are detected using nearest-neighbor features’ signals. (A) Significance was computed for every Refseq gene with at least 75% transfrag coverage using their nearest-neighbor features. These features were compared with features whose probes have identical GC content to compute their significance, or P-value (‘Methods’ section). (B) A tradeoff exists between the specificity of nearest-neighbor features and their coverage. We restricted the analysis depicted in panel (A) to nearest-neighbor features having at least 9, 8, 7, 6, or 5 mismatches. The ‘8 Mismatches’ series cannot be seen because it is nearly identical to that of ‘9 Mismatches’. Restricting to seven or fewer mismatches increases power because these probes are more specific to the nearest-neighbor target. Restricting further to six and to five mismatches decreases power because there are fewer probes that meet these criteria. (C) A set of known positives was defined as the Refseq genes with at least 75% transfrag coverage. A set of known negatives was constructed by permuting the sequences in the set of known positives. For various thresholds, sensitivity and specificity were computed and then plotted. Here, we have defined sensitivity as TP/(TP+FN) and specificity as TN/(TN+FP) where TP, TN, FP and FN stand for counts of true positives, true negatives, false positives and false negatives, respectively.
Figure 4.
Figure 4.
Nearest-neighbor-derived exon expression levels are correlated within genes. Nearest-neighbor features’ signals were averaged within each exon and hybridization. Correlation coefficients across the 33 hybridizations were computed between pairs of randomly selected exons and between exons from the same gene. The coefficients were binned and the differences plotted. Only exons exhibiting significant change across cell lines were included in the analysis (P < 0.05, Kruskal–Wallis test).
Figure 5.
Figure 5.
Agreement between perfect match and nearest-neighbor-derived gene summaries. Average signals were computed for each gene and for each hybridization. These summaries were computed using (1) only the nearest-neighbor probes from chip01 and (2) only perfect match probes from the entire experiment. Correlation coefficients between these summaries were computed for each gene across all hybridizations. (A) A histogram of these coefficients is shown. Genes having at least twenty perfect match features were included in this analysis. (B) Box plots of these coefficients are shown for different average logged intensity bins.
Figure 6.
Figure 6.
Correlations between nearest-neighbor-derived gene summaries and perfect-match-derived gene summaries were binned on various criteria. (A) Genes were divided into ‘short’ and ‘long’ genes based on their length being less or greater than the median gene length. (B) Genes were binned based on whether or not they are present in known segmental duplications. (C) Genes were binned based on whether or not their GC content is less than or greater than the median GC content. (D) Genes were binned on their GC content (excluding nucleotides that mismatch with their nearest-neighbor probe). GC-contents greater than 50% were defined as ‘high’.
Figure 7.
Figure 7.
Correlations between k-nearest-neighbor-derived gene summaries and perfect-match-derived gene summaries are plotted for k = 1 … 100. For a given k, the k probe sequences closest to each tile were identified. A gene's expression summary is the average over all k probes’ signals for all tiles within the gene.
Figure 8.
Figure 8.
Nearest-neighbor features yield results comparable between array designs. Nearest-neighbor lookups were performed for two different tiling array designs. Each design was used for 33 hybridizations. Histograms of between-gene correlations are shown.

References

    1. Selinger DW, Cheung KJ, Mei R, Johansson EM, Richmond CS, Blattner FR, Lockhart DJ, Church GM. RNA expression analysis using a 30 base pair resolution Escherichia coli genome array. Nat. Biotechnol. 2000;18:1262–1268. - PubMed
    1. Bertone P, Stolc V, Royce TE, Rozowsky JS, Urban AE, Zhu X, Rinn JL, Tongprasit W, Samanta M, et al. Global identification of human transcribed sequences with genome tiling arrays. Science. 2004;306:2242–2246. - PubMed
    1. Kapranov P, Cawley SE, Drenkow J, Bekiranov S, Strausberg RL, Fodor SPA, Gingeras TR. Large-scale transcriptional activity in chromosomes 21 and 22. Science. 2002;296:916–919. - PubMed
    1. Jeon Y, Bekiranov S, Karnani N, Kapranov P, Ghosh S, MacAlpine D, Lee C, Hwang DS, Gingeras TR, et al. Temporal profile of replication of human chromosomes. Proc. Natl Acad. Sci. USA. 2005;102:6419–6424. - PMC - PubMed
    1. ENCODE Project Consortium. Identification and analysis of funtional elements in 1% of the human geneome by the ENCODE pilot project. Nature. 2007;447:799–816. - PMC - PubMed

Publication types

MeSH terms

Substances