. 2007 Aug 3;14(8):539-47.
doi: 10.1101/lm.606407. Print 2007 Aug.

Adrenergic modulation of olfactory bulb circuitry affects odor discrimination

Affiliations

Adrenergic modulation of olfactory bulb circuitry affects odor discrimination

Wilder Doucette et al. Learn Mem. .

Abstract

A rodent's survival depends upon its ability to perceive odor cues necessary to guide mate selection, sexual behavior, foraging, territorial formation, and predator avoidance. Arguably, the need to discriminate odor cues in a complex olfactory environment requires a highly adaptable olfactory system. Indeed, it has been proposed that context-dependent modulation of the initial sensory relay could alter olfactory perception. Interestingly, 40% of the adrenergic innervation from the locus coeruleus, fibers that are activated by contextual cues, innervates the first relay station in the olfactory system (the main olfactory bulb). Here we utilize restricted pharmacological inhibition of olfactory bulb noradrenergic receptors in awake-behaving animals. We show that combined blockade of alpha and beta adrenergic receptors does not impair two-odor discrimination behavior per se but does impair the ability to discriminate perceptually similar odors. Thus, contextual cues conveyed by noradrenergic fibers alter processing before the second synapse in the olfactory cortex, resulting in tuning of the ability to discriminate between similar odors.


Figures

Figure 1.
Figure 1.
Diagram illustrating the role that noradrenergic modulation of olfactory bulb function has in the process of forming an odor percept. (A) The process of forming odor objects from odor features proceeds from left to right (epithelium → main olfactory bulb → olfactory cortex). The olfactory sensory neurons (OSNs) respond to the odor features in the odor stimuli (illustrated by colors of OSNs that correspond to the color of the odor features they respond to). In the MOB, the axons of the OSNs transmit information to the mitral and tufted cells (M/T) that are represented as cells with triangular bodies. The signal is altered by interactions with interneurons (granule cells [Gr] and periglomerular cells [Pg]) represented as circles. The relative quantity of incoming adrenergic innervation from the locus coeruleus (LC) to the different layers of the MOB network is represented by the size of the arrows (McLean et al. 1989; Shepherd et al. 2004). On the far right side, geometrical objects illustrate olfactory percepts in the olfactory cortex. (B) On the far left, the activation matrix displays squares representing molecular features for odor A and the mixture A + B for dissimilar (D) and similar (S) odor pairs. The unique 3D shapes representing the perceived odor objects illustrate the outcome of bulbar and cortical processing (“Percepts”). The odor objects within the “naïve” circle represent odor objects for similar and dissimilar odors as perceived after novel odor application before learning in the go–no go task. The “shapes” of the odor objects change after training, illustrated by the odor objects in the “trained” rectangle. The transition from naïve to trained shapes illustrates how the similar odor objects (A and A + B) diverge in shape during the discrimination task (Linster et al. 2002). In this paper, we present data that indicate NE signaling within the MOB is involved in the process of modifying the odor object to facilitate discrimination.
Figure 2.
Figure 2.
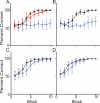
Learning curves for treated and control animals discriminating odor pairs of varying perceptual similarity. (A) Propyl acetate versus propyl acetate + ethyl acetate (acetate pair); (B) 1-heptanol versus 1-heptanol + 1-octanol (alcohol pair); (C) 2-heptanone versus 2-heptanone + 3-heptanone (ketone pair); (D) propionic acid versus propionic acid + benzaldehyde (acid + aldehyde pair). Learning curves for the saline- (black), phentolamine- (green), alprenolol- (red), and the combined alprenolol/phentolamine-treated (blue) groups. Error bars represent the standard deviation (n = 6).
Figure 3.
Figure 3.
Differences in the behaviorally determined perceptual similarity index for each odor pair. The four odor pairs fell into one of two groups, low or high odor similarity index (OSI) values, which corresponds to perceptually dissimilar or perceptually similar, respectively. “PA & B” is short for the propionic acid + benzaldehyde odor pair, and “PA & B Retest” is the propionic acid + benzaldehyde odor pair that was retested for similarity after completion of the initial four odor pairs. Error bars represent the standard deviation (n = 6).
Figure 4.
Figure 4.
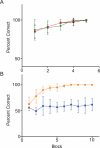
Performance of mice in an odor memory task. (A) Animals from Fig. 2A were retested 48 h later for memory of the acetate odor pair discrimination task (no drugs or saline were injected in this memory retest). Mice receiving saline (black), alprenolol (red), or phentolamine (green) treatment in the previous go–no go session were all able to retain the ability to continue the discrimination. (B) Group of animals that received no treatment for the acetate odor pair and successfully completed the discrimination received a combination injection (orange) immediately before the memory retest. The combination injection did not impair the ongoing discrimination, and the NIV was significantly different (P < 0.0001) from the group of animals receiving the combination injection during the initial acetate learning session (blue in B; also shown in Fig. 1A). Error bars represent the standard deviation (n = 6).
Figure 5.
Figure 5.
Volume and concentration of drugs used were not excessive. (A) Learning curves for the unimplanted group (gray) alongside the saline-treated group (black). There was no statistical difference in NIV between these groups. (B) Learning curves for the alcohol odor pair showing the saline group (black) and a group receiving the combination injection at a quarter of the concentration used in previous figures (gray). Animals receiving the quarter concentration injection did not differ statistically from the saline-injected group in their NIV values (P = 0.987). (C) Histogram showing the fractional reduction of the NIV values for the alcohol pair, from the saline curve (0) to a theoretical animal performing at chance (1.0), by the quarter concentration (7 nmol) and normal combination injection (28 nmol). Error bars represent the standard deviation (n = 6).
Figure 6.
Figure 6.
Learning curves for the alcohol odor pair following saline, normal combination and two selective antagonist combination groups. (A) Learning curves for the selective β antagonists (CGP-20712A and ICI-118551) combined with phentolamine (brown) are shown along with the learning curves for normal combination (alprenolol/phentolamine) injection (blue) and the saline control (black). The NIV of the selective β combination injection was not significantly different from the normal combination injection (P = 0.576) and was significantly different from the saline-injected group (P < 0.0001). (B) Selective α antagonists (terazosin and yohimbine) combined with alprenolol (brown) shown alongside normal combination (blue) and saline (black) learning curves. The NIV of the selective α combination injection was not significantly different from the normal combination injection (P = 1) and was significantly different from the saline-injected group (P < 0.0001). Error bars denote standard deviations (n = 6).
Figure 7.
Figure 7.
l-[4,6-Propyl-3H]dihydroalprenolol ([3H]DHA) diffusion and related control experiments. (A) [3H]DHA diffusion curves: (i) bulb; (ii) rest of brain. The origin of the rostrocaudal axis was the first section with mitral cells for the main olfactory bulb (MOB) (i) and the first section after the cut separating the rest of the brain from MOB for the rest of the brain (ii). The dashed gray line displays the average concentration of [3H]DHA found in the rest of the brain. (B) Black line over sagittal brain section illustrates the cut used to separate the bulb from the rest of the brain prior to sectioning. (C) Percent of total injected [3H]DHA per gram of various tissues (n = 2). (D) IP [3H]DHA injections of varying concentration and the resultant measured brain concentrations. The dashed gray line illustrates the target concentration of [3H]DHA achieved with a 3 mg/kg IP injection. (E) Learning curve for the alcohol odor pair illustrating the saline group and one that received an IP injection of alprenolol (3 mg/kg) and phentolamine (4 mg/kg). The learning curves in E display saline- (black) and IP-injected groups (gray). Error bars represent the standard deviation (n = 6).
Figure 8.
Figure 8.
Defining the normalized integration value (NIV) for a learning curve of one animal in the saline treatment group. Each square in the curve represents the percent of the trials where odors were identified correctly within one block of 20 trials (10 S+ and 10 S− trials presented at random). To obtain a single number indicative of the performance of the animal in this odor discrimination task, we calculated the area under the curve (white area) and then normalized the value by dividing it by the area under the curve for a theoretical animal performing perfectly (100% correct) in all 10 blocks (gray + white area).

Similar articles

Cited by

References

    1. Abraham N.M., Spors H., Carleton A., Margrie T.W., Kuner T., Schaefer A.T. Maintaining accuracy at the expense of speed: Stimulus similarity defines odor discrimination time in mice. Neuron. 2004;44:865–876. - PubMed
    1. Baker J.G. The selectivity of β-adrenoceptor antagonists at the human β1, β2 and β3 adrenoceptors. Br. J. Pharmacol. 2005;144:317–322. - PMC - PubMed
    1. Berridge C.W., Waterhouse B.D. The locus coeruleus–noradrenergic system: Modulation of behavioral state and state-dependent cognitive processes. Brain Res. Brain Res. Rev. 2003;42:33–84. - PubMed
    1. Bouret S., Sara S.J. Locus coeruleus activation modulates firing rate and temporal organization of odour-induced single-cell responses in rat piriform cortex. Eur. J. Neurosci. 2002;16:2371–2382. - PubMed
    1. Bouret S., Sara S.J. Reward expectation, orientation of attention and locus coeruleus–medial frontal cortex interplay during learning. Eur. J. Neurosci. 2004;20:791–802. - PubMed

Publication types

LinkOut - more resources