

Loss of T cell receptor-induced Bmi-1 in the KLRG1(+) senescent CD8(+) T lymphocyte
- PMID: 17686974
- PMCID: PMC1941641
- DOI: 10.1073/pnas.0706040104
Loss of T cell receptor-induced Bmi-1 in the KLRG1(+) senescent CD8(+) T lymphocyte
Abstract
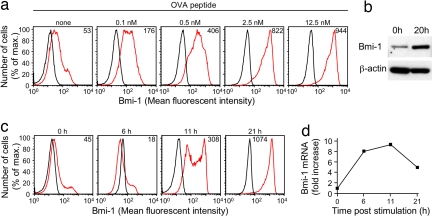
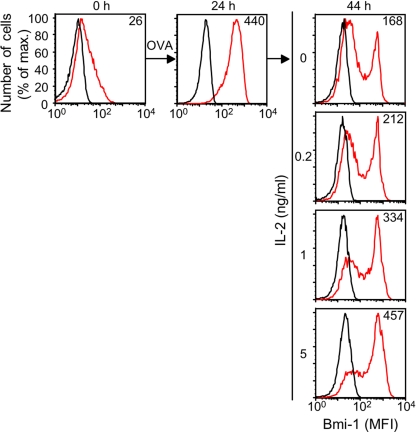
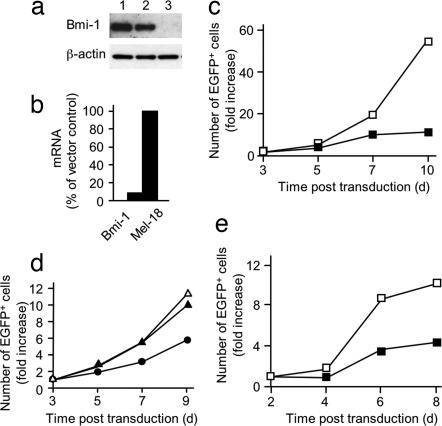
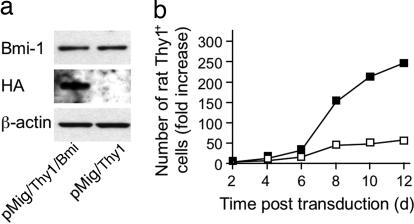
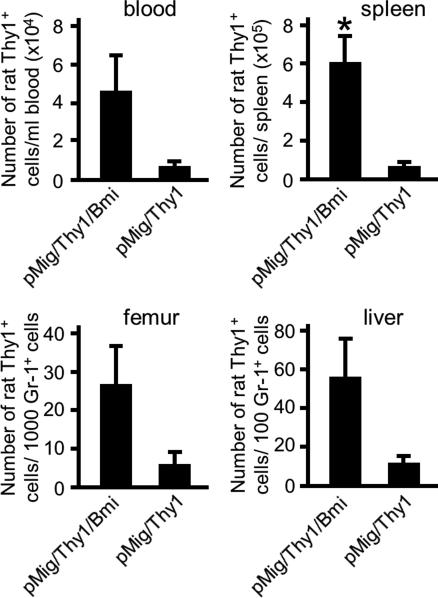
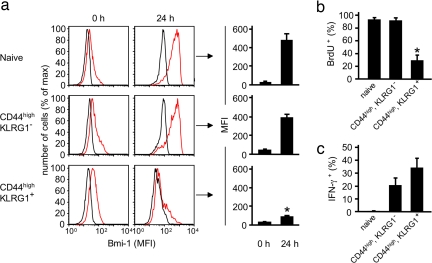
Clones of CD8(+) T cells specific for viral antigens must avoid replicative senescence to maintain continuous production of new effector cells during chronic viral infections. In the present study, we have determined whether this capability may be related to Bmi-1, a transcriptional repressor that is required for the maintenance of hematopoietic stem cells and certain neural stem cells and that mediates its antisenescence function by inhibiting transcription of the Ink4a/Arf tumor suppressor locus. Ligation of the T cell receptor increased the levels of Bmi-1 mRNA and protein in primary CD8(+) T cells. The increased expression was reversible upon removal of antigen but could be maintained by using stimulation with the IL-2 receptor. Specific suppression of Bmi-1 by using a lentivirally encoded short hairpin RNA inhibited the proliferation of IL-2-stimulated CTLL-2 cytotoxic T cells and primary CD8(+) T cells. Ectopically expressed Bmi-1 enhanced the expansion of primary CD8(+) T cells stimulated by IL-2 and IL-7 in vitro and by homeostatic signals in vivo. Taken together, these findings indicate that Bmi-1 is required for CD8(+) T cell clonal expansion and is positively regulated by receptors that mediate this response. Therefore, the observation that the ability of the T cell receptor to induce Bmi-1 is maintained in the subset of replication-competent, antigen-experienced CD8(+) T cells that do not express the killer cell lectin-like receptor G1 (KLRG1) but is developmentally switched off in the senescent, KLRG1(+) subset suggests that Bmi-1 is a molecular determinant of the capacity of a CD8(+) T cell clone to persist during chronic viral infections.
Conflict of interest statement
The authors declare no conflict of interest.
Figures
Similar articles
-
Bcl-2 allows effector and memory CD8+ T cells to tolerate higher expression of Bim.J Immunol. 2011 May 15;186(10):5729-37. doi: 10.4049/jimmunol.1100102. Epub 2011 Mar 30. J Immunol. 2011. PMID: 21451108 Free PMC article.
-
KLRG1+NKG2A+ CD8 T cells mediate protection and participate in memory responses during γ-herpesvirus infection.J Immunol. 2011 Apr 1;186(7):4051-8. doi: 10.4049/jimmunol.1003122. Epub 2011 Feb 23. J Immunol. 2011. PMID: 21346231 Free PMC article.
-
Expanded CD8+ T cells of murine and human CLL are driven into a senescent KLRG1+ effector memory phenotype.Cancer Immunol Immunother. 2013 Nov;62(11):1697-1709. doi: 10.1007/s00262-013-1473-z. Cancer Immunol Immunother. 2013. PMID: 24022692 Free PMC article.
-
The expansion and maintenance of antigen-selected CD8(+) T cell clones.Adv Immunol. 2007;96:103-39. doi: 10.1016/S0065-2776(07)96003-4. Adv Immunol. 2007. PMID: 17981205 Review.
-
KLRG1--more than a marker for T cell senescence.Age (Dordr). 2009 Dec;31(4):285-91. doi: 10.1007/s11357-009-9100-9. Age (Dordr). 2009. PMID: 19479342 Free PMC article. Review.
Cited by
-
IL-7 and IL-15 differentially regulate CD8+ T-cell subsets during contraction of the immune response.Blood. 2008 Nov 1;112(9):3704-12. doi: 10.1182/blood-2008-06-160945. Epub 2008 Aug 8. Blood. 2008. PMID: 18689546 Free PMC article.
-
T-bet-mediated differentiation of the activated CD8+ T cell.Eur J Immunol. 2011 Jan;41(1):60-6. doi: 10.1002/eji.201040873. Epub 2010 Dec 9. Eur J Immunol. 2011. PMID: 21182077 Free PMC article.
-
The expanding Pandora's toolbox of CD8+T cell: from transcriptional control to metabolic firing.J Transl Med. 2023 Dec 11;21(1):905. doi: 10.1186/s12967-023-04775-3. J Transl Med. 2023. PMID: 38082437 Free PMC article. Review.
-
Cellular Senescence in Hepatocellular Carcinoma: The Passenger or the Driver?Cells. 2022 Dec 29;12(1):132. doi: 10.3390/cells12010132. Cells. 2022. PMID: 36611926 Free PMC article. Review.
-
The role of KLRG1: a novel biomarker and new therapeutic target.Cell Commun Signal. 2024 Jun 19;22(1):337. doi: 10.1186/s12964-024-01714-7. Cell Commun Signal. 2024. PMID: 38898461 Free PMC article. Review.
References
-
- Wherry EJ, Teichgraber V, Becker TC, Masopust D, Kaech SM, Antia R, von Andrian UH, Ahmed R. Nat Immunol. 2003;4:225–234. - PubMed
-
- Bachmann MF, Wolint P, Schwarz K, Jager P, Oxenius A. J Immunol. 2005;175:4686–4696. - PubMed
-
- Kaech SM, Tan JT, Wherry EJ, Konieczny BT, Surh CD, Ahmed R. Nat Immunol. 2003;4:1191–1198. - PubMed
Publication types
MeSH terms
Substances
Grants and funding
LinkOut - more resources
Full Text Sources
Other Literature Sources
Research Materials
