Comparative Study
. 2007 Aug 8;27(32):8546-57.
doi: 10.1523/JNEUROSCI.1269-07.2007.

Competing interactions between micro-RNAs determine neural progenitor survival and proliferation after ethanol exposure: evidence from an ex vivo model of the fetal cerebral cortical neuroepithelium

Affiliations
Comparative Study

Competing interactions between micro-RNAs determine neural progenitor survival and proliferation after ethanol exposure: evidence from an ex vivo model of the fetal cerebral cortical neuroepithelium

Pratheesh Sathyan et al. J Neurosci. .

Abstract

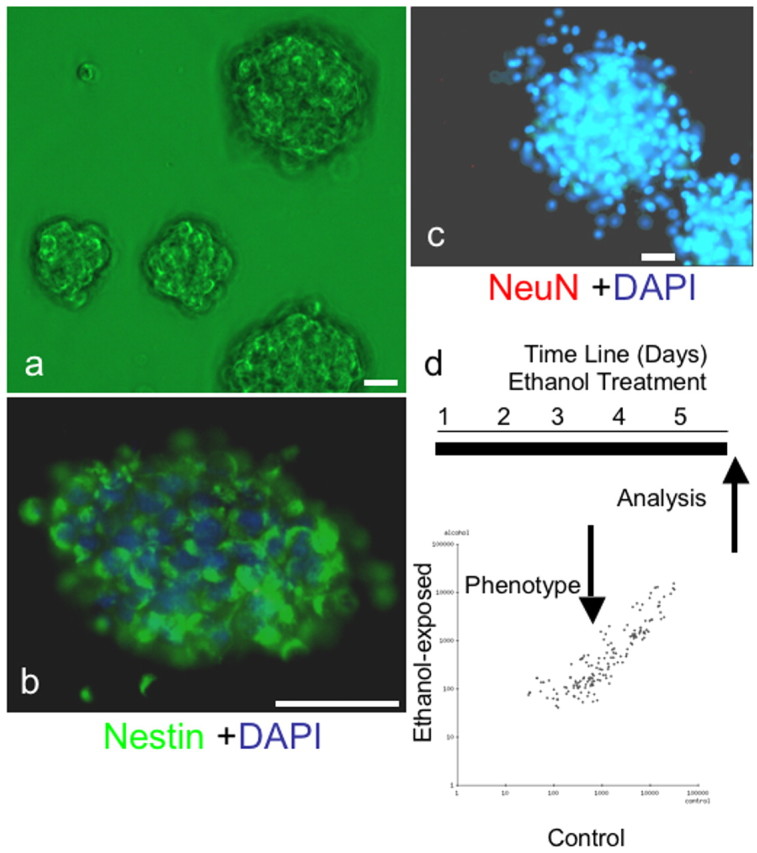
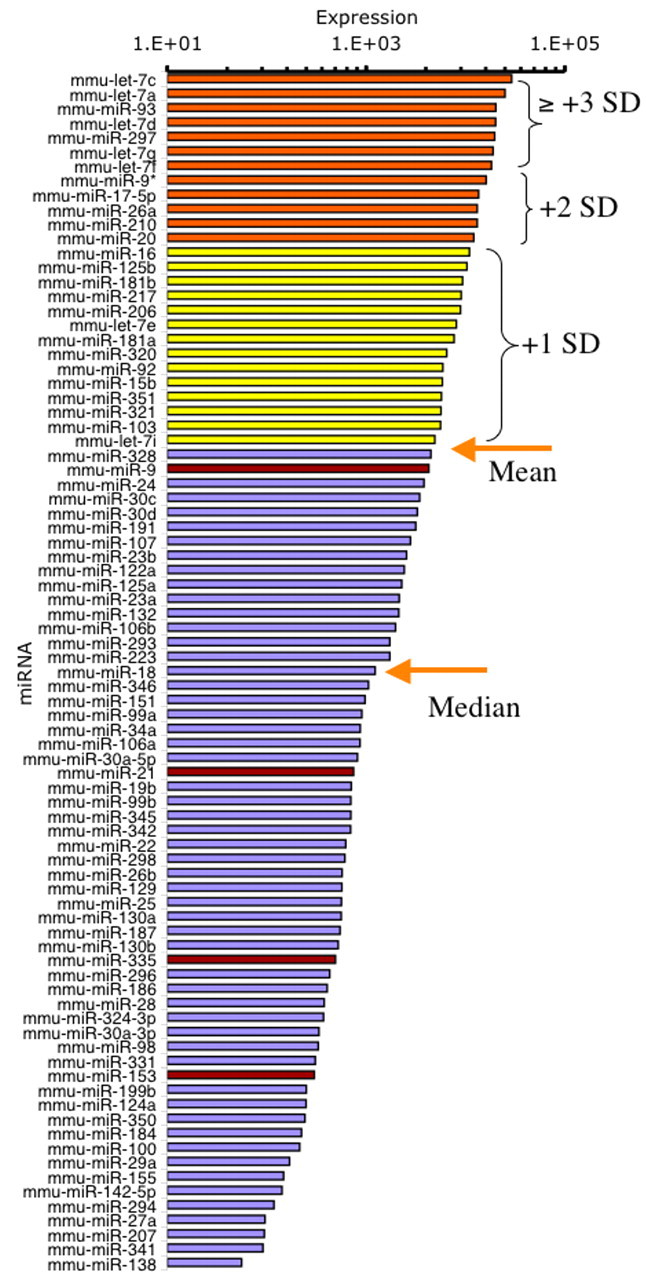
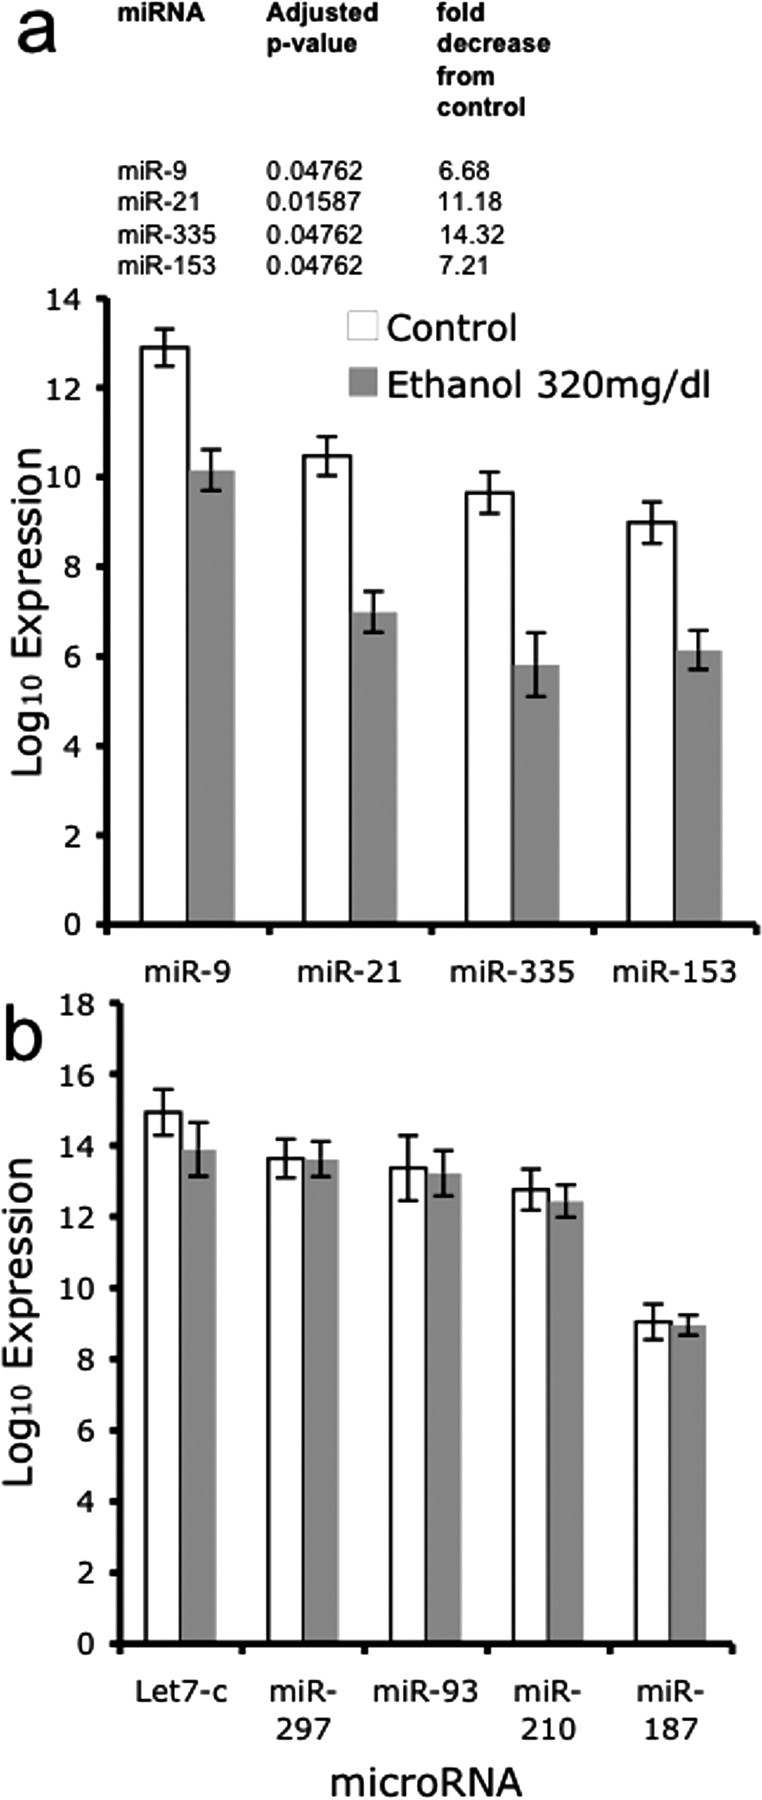
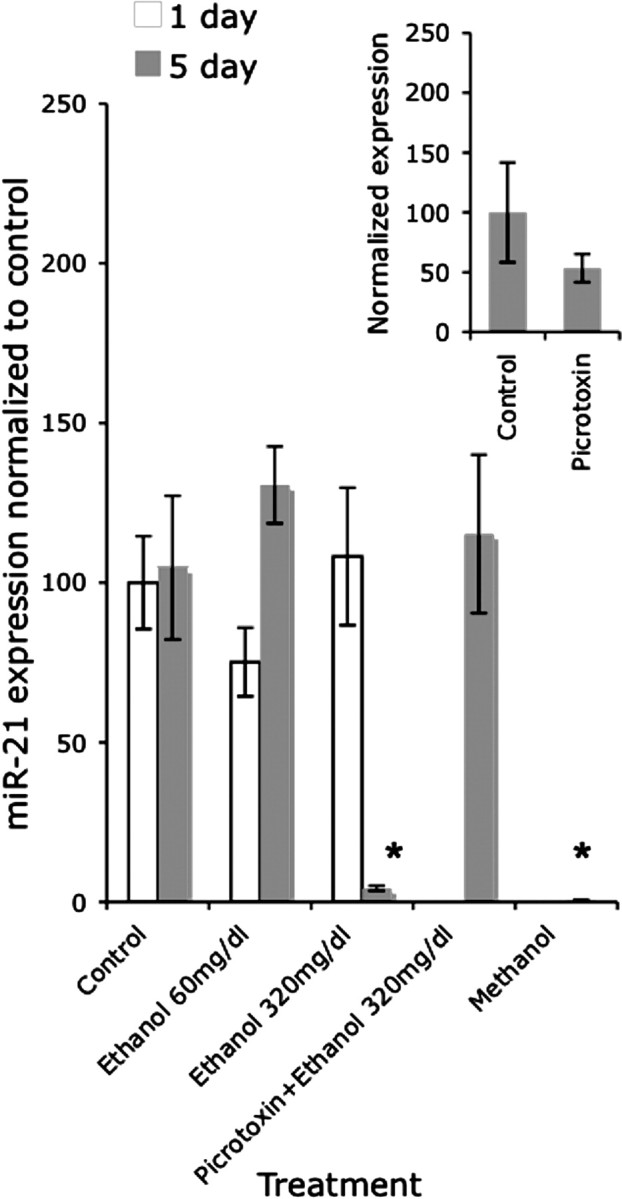
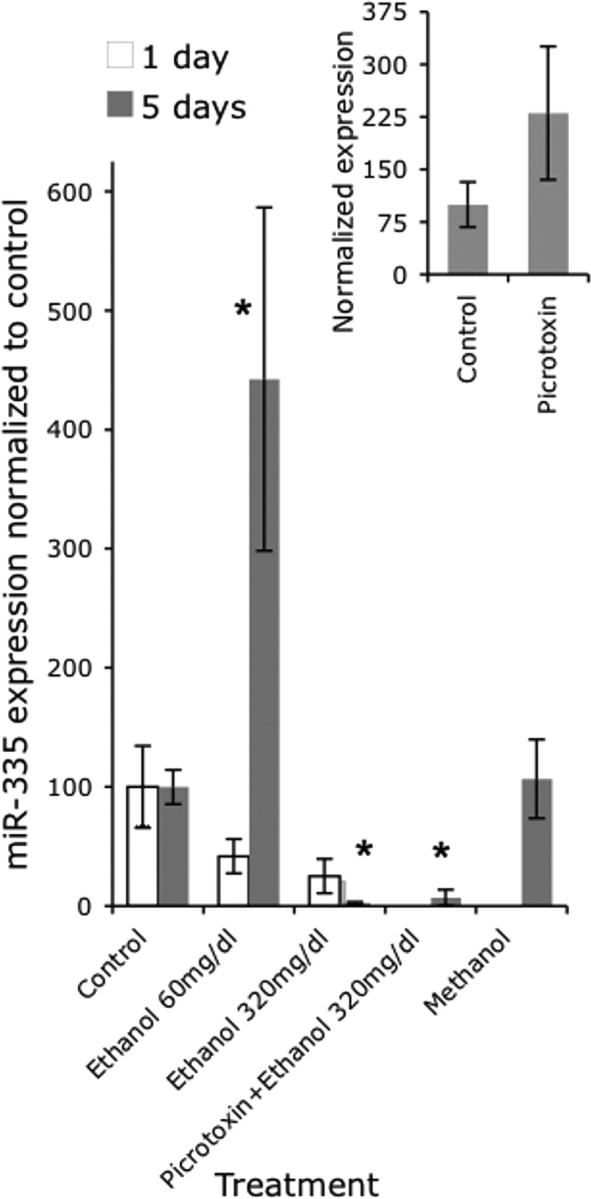
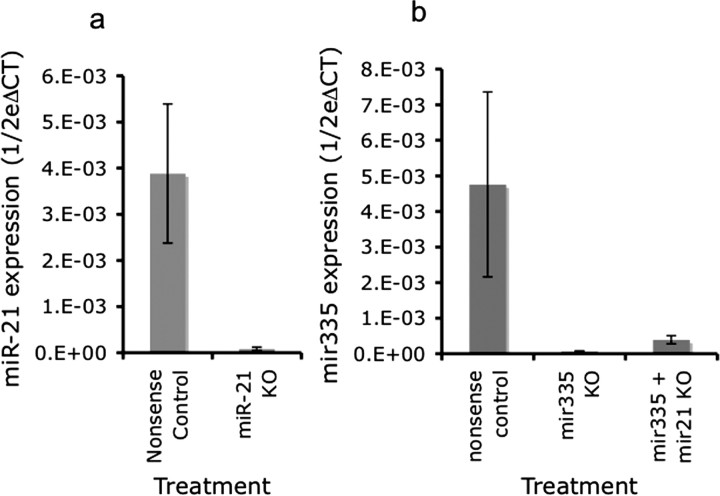
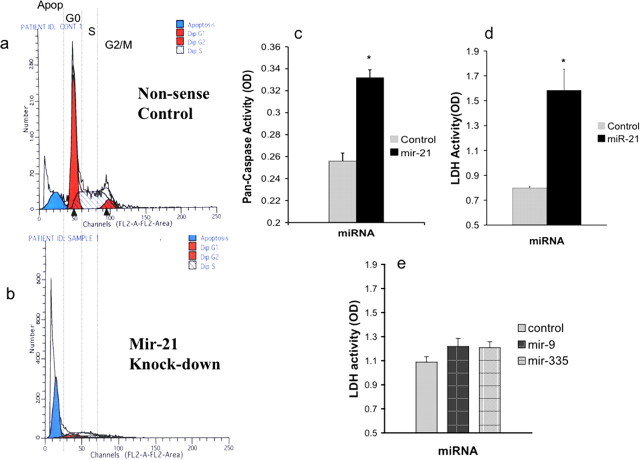
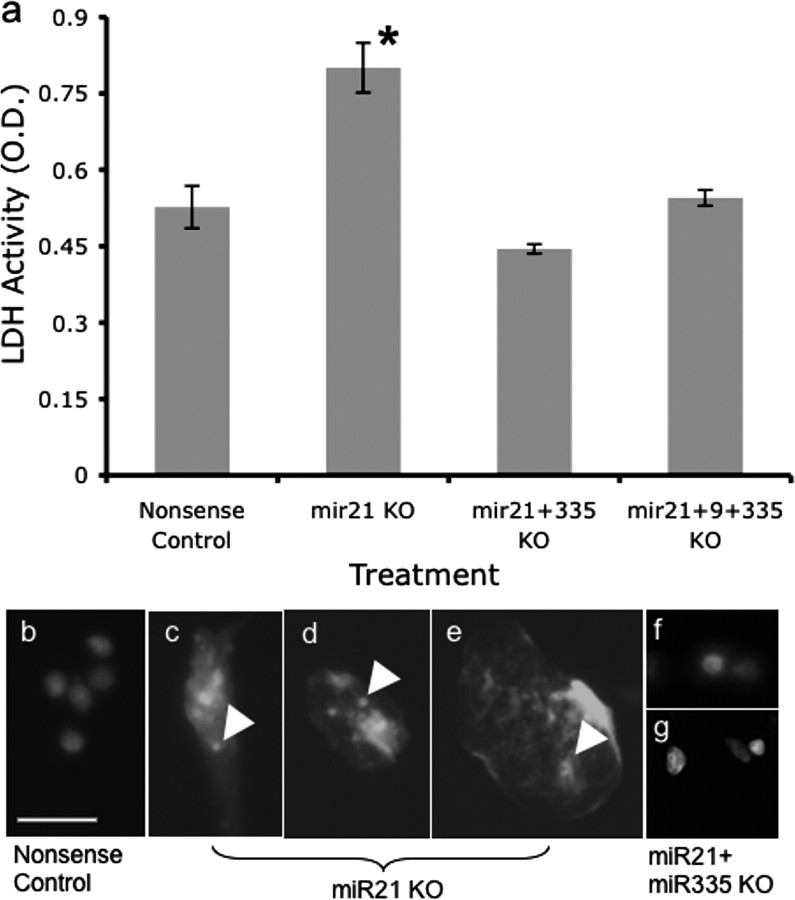
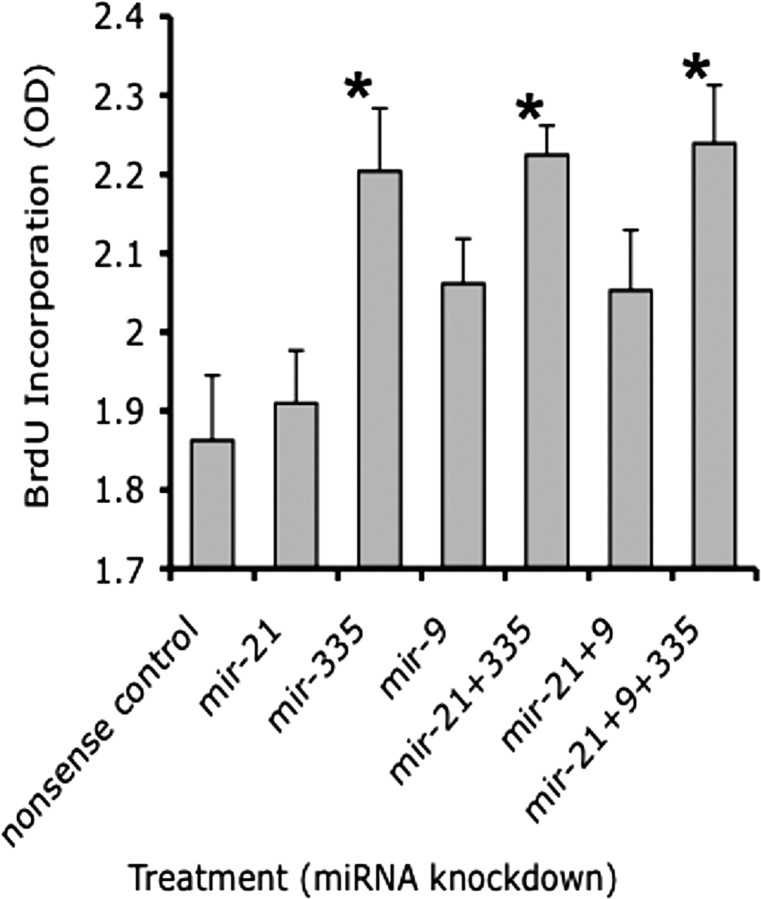
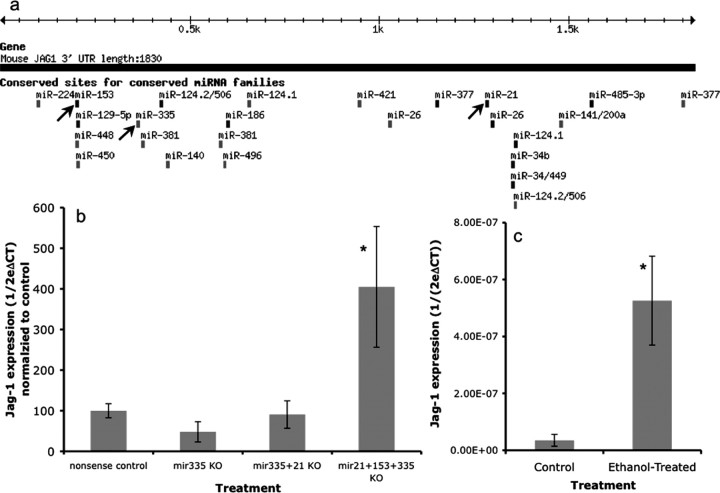
The fetal brain is sensitive to a variety of teratogens, including ethanol. We showed previously that ethanol induced mitosis and stem cell maturation, but not death, in fetal cerebral cortex-derived progenitors. We tested the hypothesis that micro-RNAs (miRNAs) could mediate the teratogenic effects of ethanol in a fetal mouse cerebral cortex-derived neurosphere culture model. Ethanol, at a level attained by alcoholics, significantly suppressed the expression of four miRNAs, miR-21, -335, -9, and -153, whereas a lower ethanol concentration, attainable during social drinking, induced miR-335 expression. A GABA(A) receptor-dependent mechanism mediated miR-21, but not miR-335 suppression, suggesting that divergent mechanisms regulate ethanol-sensitive miRNAs. Antisense-mediated suppression of miR-21 expression resulted in apoptosis, suggesting that miR-21 is an antiapoptotic factor. miR-335 knockdown promoted cell proliferation and prevented death induced by concurrently suppressing miR-21, indicating that miR-335 is a proapoptotic, antimitogenic factor whose actions are antagonistic to miR-21. Computational analyses identified two genes, Jagged-1, a Notch-receptor ligand, and embryonic-lethal abnormal vision, Drosophila-like 2 (ELAVL2), a brain-specific regulator of RNA stability, as presumptive targets of three of four ethanol-sensitive micro-RNAs. Combined knockdown of miR-335, -21, and -153 significantly increased Jagged-1 mRNA. Furthermore, ethanol induced both Jagged-1 and ELAVL2 mRNA. The collective suppression of micro-RNAs is consistent with ethanol induction of cell cycle and neuroepithelial maturation in the absence of apoptosis. These data identify a role for micro-RNAs as epigenetic intermediaries, which permit teratogens to shape complex, divergent developmental processes, and additionally demonstrate that coordinately regulated miRNAs exhibit both functional synergy and antagonism toward each other.


Figures

Figure 1.
Figure 1.
a, Mouse neocortical precursors isolated from GD12.5 fetal mice (see Materials and Methods) were grown as neurosphere cultures in mitogenic medium (+bFGF/+hEGF/+LIF). b, c, Neurosphere cultures are immunopositive for nestin (fluorescein, green; b). However, cultures lacked nuclear localization of NeuN (rhodamine, red; c), confirming the immaturity of neurospheres. Cell nuclei are counter-stained with DAPI (blue). d, Schematic of experimental model depicting the temporal sequence of ethanol treatment and analysis. The scatter-plot depicts miRNA expression (fluorescence intensity) in control (x-axis) and ethanol-treated (y-axis) cultures. Data points represent mean values based on five independent replicates. Scale bars, 50 μm.
Figure 2.
Figure 2.
Histogram depicting the rank-ordered expression of miRNAs as a function of their abundance (mean microarray hybridization fluorescence intensity) in five independent control samples. Microarray data were first filtered using a univariate mixture-modeling algorithm (see Materials and Methods), to identify miRNAs that were reliably expressed in embryonic cortical neuroepithelial-derived neurosphere cultures. Filtered miRNAs were then rank ordered by their hybridization intensity. Orange arrows mark the mean and median hybridization intensities of the filtered miRNAs. The divergence between the mean and median intensity values indicates that there are a few miRNAs, from the let-7 family for example, that are highly overexpressed compared with a majority of other miRNAs. Yellow bars indicate miRNAs that are expressed at 1 SD above the mean intensity, whereas orange bars indicate expression at 2 or greater SDs above the mean intensity. Red bars denote miRNAs that were significantly suppressed by ethanol. The histogram indicates that ethanol targets the moderately expressed miRNAs, rather than the highly expressed miRNAs, in cortical neuroepithilal cells.
Figure 3.
Figure 3.
Bar graphs depicting the expression of miRNAs in control and ethanol-exposed conditions. The x-axis depicts treatment conditions, whereas the y-axis depicts the log10 of the average signal intensity over five arrays. Data are expressed as mean ± SEM. a, Bar graphs depicting the mean intensity values of four microRNAs (miR-9, -21, -335, and -153) that were significantly suppressed by exposure to ethanol at 320 mg/dl for 5 d. Inset, Adjusted (Benjamini and Hochberg correction for multiple comparisons) p values and fold suppression of the statistically significant miRNAs. b, Sample of high to moderately expressed miRNAs that are identified as expressed in cortical neuroepithelial cells, according to microarray analysis, but not targeted by ethanol.
Figure 4.
Figure 4.
Bar graph depicting miR-21 expression using real-time RT-PCR in response to two doses of ethanol (60 and 320 mg/dl) at two different time points (1 and 5 d). The y-axis indicates expression of miR-21 relative to U6 small nuclear RNA (U6SNR) in various treatment groups (expressed as (expressed as 12ΔCD(miR21-U6SNR))), normalized to the average of the expression in control, nonsense transfected cultures (X¯control(12ΔCD(miR21-U6SNR)) ). At 5 d, the 320 mg/dl dose significantly decreased miR-21 expression. Concurrent exposure to picrotoxin prevented the decrease in miR-21 induced by the high dose of ethanol 5 d with 320 mg/dl. Methanol at 320 mg/dl or 5 d also significantly decreased miR-21 expression. The inset graph indicates that picrotoxin by itself (at 100 μm for 5 d) did not induce a statistically significant change in miR-21 expression. Data were expressed as mean ± SEM. Asterisks indicate statistical significance compared with controls; p values are as indicated in the text.
Figure 5.
Figure 5.
Bar graph depicting miR-335 expression using real-time RT-PCR in response two doses of ethanol (60 and 320 mg/dl) at two different time points (1 and 5 d). At 5 d, the low dose caused a statistically significant induction, whereas the high dose caused a statistically significant suppression of miR-335 expression compared with controls. Concurrent exposure to picrotoxin did not prevent the suppression in miR-335 expression induced by the high dose of ethanol compared with controls. Methanol at 320 mg/dl for 5 d did not alter miR-335 expression. The inset graph indicates that picrotoxin by itself (at 100 μm for 5 d) did not induce a statistically significant change in miR-335 expression. The y-axis indicates normalized miRNA expression (expressed as 12ΔCD(miR21-U6SNR), normalized to the mean expression in control cultures, as in Fig. 4). Data were expressed as mean ± SEM. Asterisks indicate statistical significance compared with controls; p values are as indicated in the text.
Figure 6.
Figure 6.
a, Real-time RT-PCR illustrating significant downregulation of miR-21 after miR-21 knockdown with antisense 2′ O-methyl bases compared with control (nonsense oligonucleotide). The y-axis (expressed as 1/2ΔCT) indicates miRNA expression in cultures, normalized to U6SNR. b, Bar graph depicting miR-335 expression after either miR-335 knockdown alone, or in combination with miR-21 knockdown. miR-335 expression in the combined knockdown of miR-21 and miR-335 was similar to the expression after miR-335 knockdown alone. Data were expressed as mean ± SEM.
Figure 7.
Figure 7.
Frequency histograms representing flow cytometric analysis of DNA content. a, b, The x-axes represents fluorescence intensity caused by propidium iodide (PI) incorporation and the y-axes depicts cell frequency. Cultures were treated with nonsense (a) or miR-21 antisense (b) for a period of 7 h. Control, Nonsense oligonucleotide-treated cultures exhibit a peak cell frequency of PI incorporation at G0, and peaks at S-phase and G2/M, with greater than G0 PI intensity. However, a low frequency of cells are observed with less than G0 DNA content, indicative of a low level of apoptosis. In contrast, miR-21 antisense-treated cultures (a) exhibit a large peak-frequency of cells at less than G0 DNA content, indicating that a majority of cells were apoptotic. c, A pan-caspase assay measuring the activation of a combination of initiator and executioner caspases (caspases 2, 3, 6, 7, 8, 9, and 10) shows that miR-21 knockdown significantly induced the activation of caspases. The y-axis depicts a photometric [optical density (OD)] measurement of pan-caspase activity, whereas the x-axis depicts the experimental condition, transfection with nonsense control or antisense to miR-21. d, LDH activity was measured as an alternate index of cell death, and showed that miR-21 knockdown significantly induced LDH release into the culture medium. The y-axis depicts photometric determination (expressed in OD units) of LDH activity in culture medium, whereas the x-axis denotes the treatment condition. e, Knockdown of miR-9 and miR-335 did not significantly alter LDH release and cell death compared with nonsense control. Each experiment was based on more than six independent replicates and data are expressed as mean ± SEM. Asterisks indicate statistical significance compared with controls; p values are as indicated in the text.
Figure 8.
Figure 8.
a, LDH cell death assay showed that miR-21 knockdown induced statistically significant cell death, as reported previously in Figure 7. Concurrent exposure to antisense for miR-335 or for miR-335 plus miR-9 completely prevented the cell death induced by transfection with the antisense to miR-21. Data were based on eight independent replicates and expressed as mean ± SEM. Asterisks indicate statistical significance compared with controls; p values are as indicated in the text. b, Labeling of DNA with DAPI reveals the presence of intact nuclei in nonsense controls. c, d, Exposure to antisense anti-miR-21 induced nuclear fragmentation. f, g, Concurrent exposure to anti-miR-335 antisense along with anti-miR-21 antisense prevented cell death induced by anti-miR-21 alone. Photomicrographs were obtained from cells fixed 7 h after transfection. Arrowheads depict the presence of nuclear DNA fragments dispersed within the cytoplasm. Scale bar: (in b) b–g, 25 μm.
Figure 9.
Figure 9.
BrdU incorporation was used to estimate the effect of miRNA knockdown on cell cycle. Cells were transfected with either nonsense control or various antisense anti-miRNA oligonucleotides, either alone or in combination, for a period of 24 h in the presence of culture medium containing BrdU. The y-axis depicts BrdU incorporation [in optical density (OD) units], whereas the x-axis depicts the various treatment conditions. Knockdown of miR-335 alone or in combination with miR-21 alone, or in combination with both miR-21 and miR-9, induced a significant increase in BrdU incorporation compared with nonsense controls. Data were based on six independent replicates and expressed as mean ± SEM. Asterisks indicate statistical significance; p values are as indicated in the text.
Figure 10.
Figure 10.
a, Schematic of in silico analyses of predicted miRNA binding sites (TargetScan 3.1; www.targetscan.org) shows that three of the ethanol-sensitive miRNAs, miR-153, miR-335, and miR-21 (highlighted by arrows), bind to the 3′ untranslated region of Jag-1 mRNA. b, Bar graph indicates that combined knockdown of miR-21, -153, and miR-335 induces a statistically significant upregulation of Jag-1. Data (CT for Jag-1, relative to CT for cyclophilin-A, expressed as 12ΔCT(Jag1CyclophilinA)) were normalized to the average of the control samples (X¯control(12ΔCT(Jag1CyclophilinA))). c, The bar graph indicates that ethanol exposure (320 mg/dl for 5 d) leads to a significant increase in Jag-1 mRNA expression. Data were expressed as mean ± SEM. Asterisks indicate statistical significance compared with controls; p values are as indicated in the text.

Similar articles

Cited by

References

    1. Abe K, Niikura Y, Misawa M. GABAA receptor-mediated inhibition by ethanol of long-term potentiation in the basolateral amygdala-dentate gyrus pathway in vivo. Neuroscience. 2004;125:113–117. - PubMed
    1. Abrahante JE, Daul AL, Li M, Volk ML, Tennessen JM, Miller EA, Rougvie AE. The Caenorhabditis elegans hunchback-like gene lin-57/hbl-1 controls developmental time and is regulated by microRNAs. Dev Cell. 2003;4:625–637. - PubMed
    1. Adachi J, Mizoi Y, Fukunaga T, Ogawa Y, Ueno Y, Imamichi H. Degrees of alcohol intoxication in 117 hospitalized cases. J Stud Alcohol. 1991;52:448–453. - PubMed
    1. Akamatsu W, Okano HJ, Osumi N, Inoue T, Nakamura S, Sakakibara S, Miura M, Matsuo N, Darnell RB, Okano H. Mammalian ELAV-like neuronal RNA-binding proteins HuB and HuC promote neuronal development in both the central and the peripheral nervous systems. Proc Natl Acad Sci USA. 1999;96:9885–9890. - PMC - PubMed
    1. Akamatsu W, Fujihara H, Mitsuhashi T, Yano M, Shibata S, Hayakawa Y, Okano HJ, Sakakibara S, Takano H, Takano T, Takahashi T, Noda T, Okano H. The RNA-binding protein HuD regulates neuronal cell identity and maturation. Proc Natl Acad Sci USA. 2005;102:4625–4630. - PMC - PubMed

Publication types

MeSH terms