Comparative Study
. 2007 Aug 8;27(32):8616-27.
doi: 10.1523/JNEUROSCI.5041-06.2007.

Kinetic properties of Cl uptake mediated by Na+-dependent K+-2Cl cotransport in immature rat neocortical neurons

Affiliations
Comparative Study

Kinetic properties of Cl uptake mediated by Na+-dependent K+-2Cl cotransport in immature rat neocortical neurons

Katharina Achilles et al. J Neurosci. .

Abstract

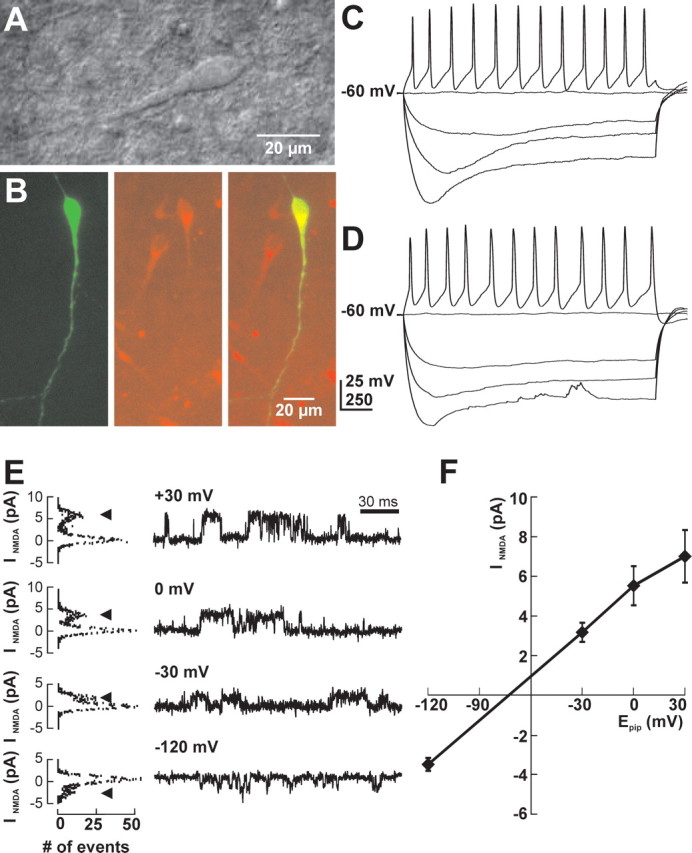
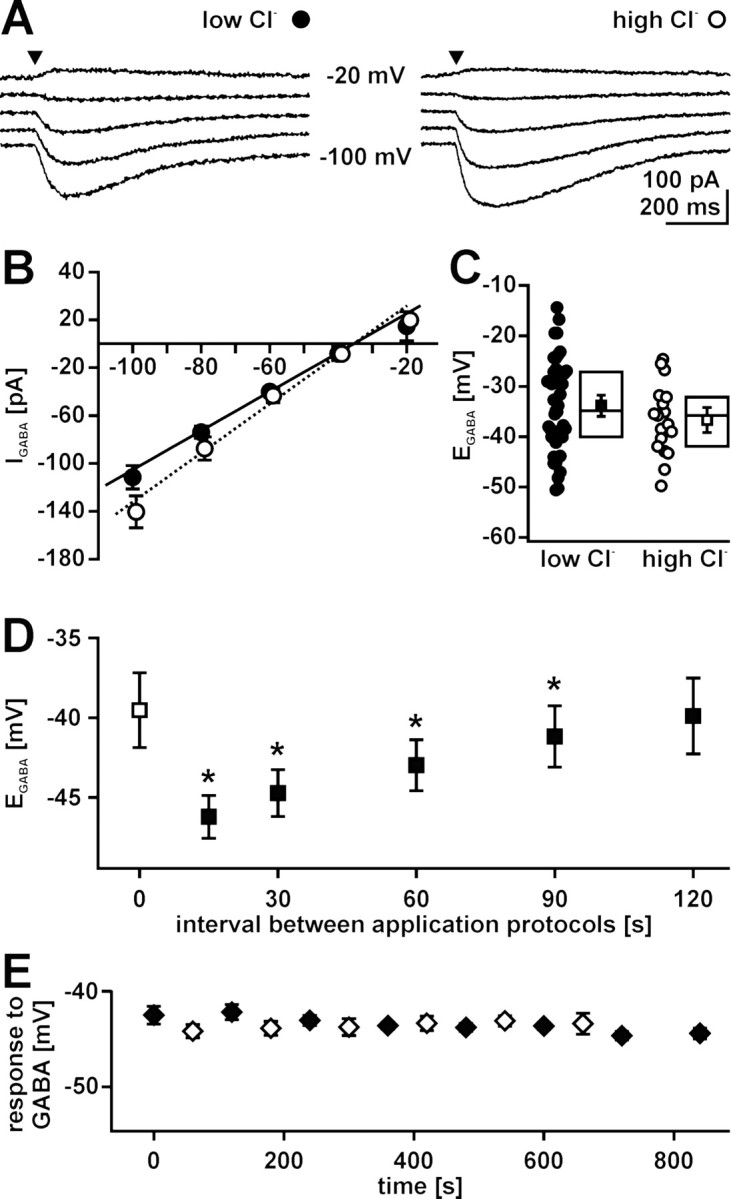
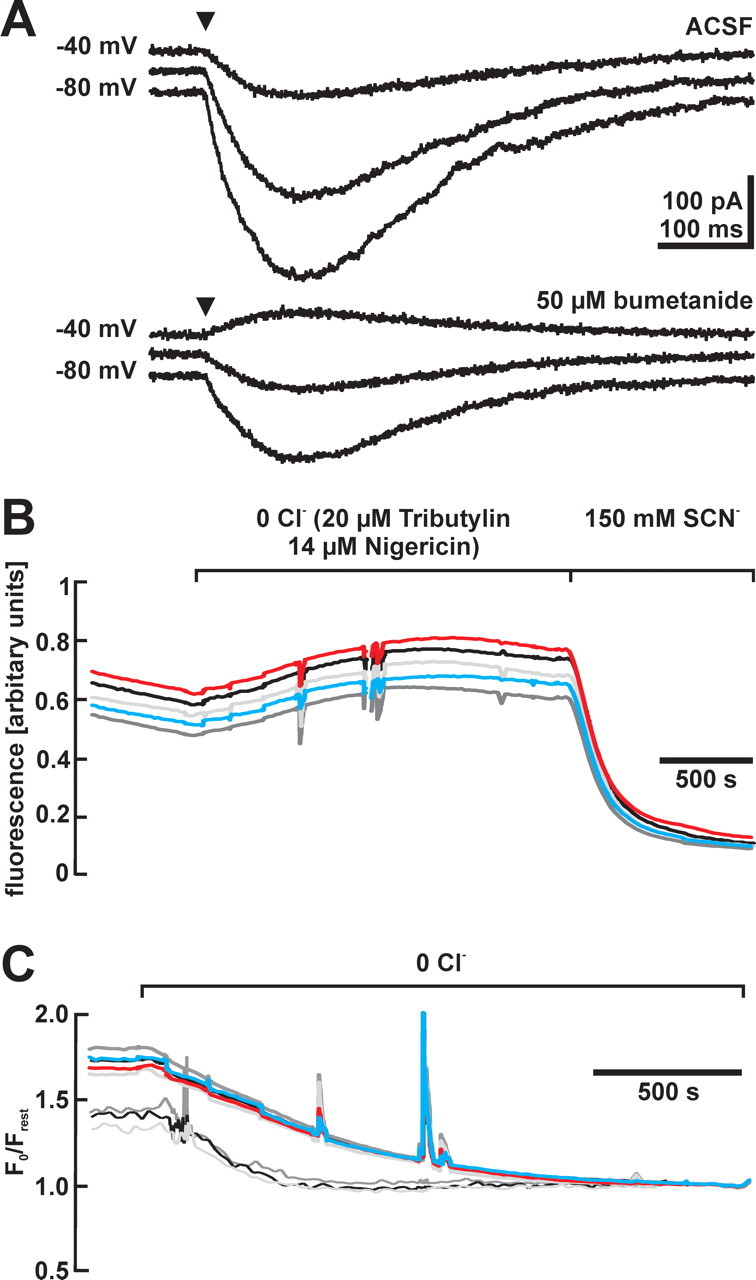
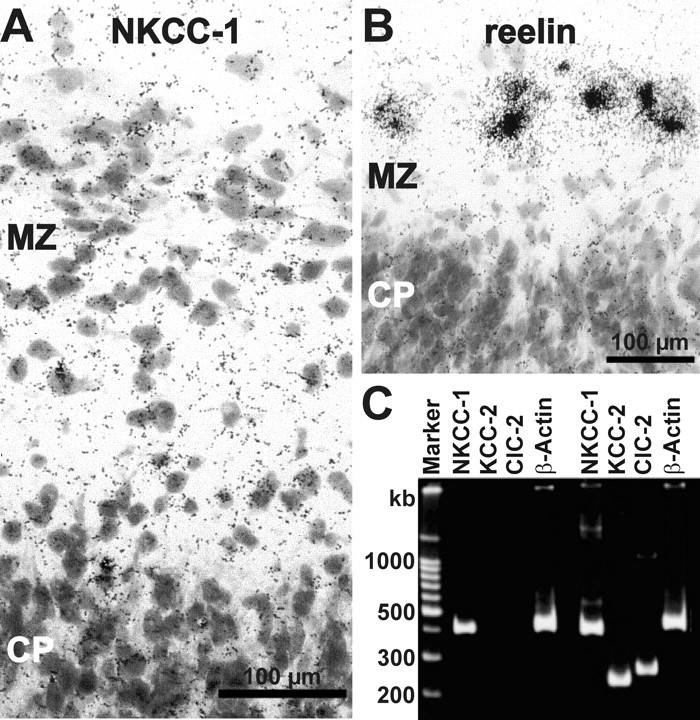
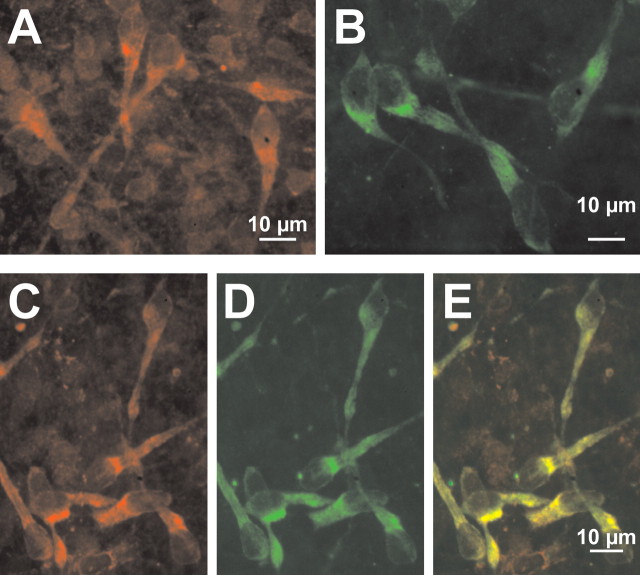
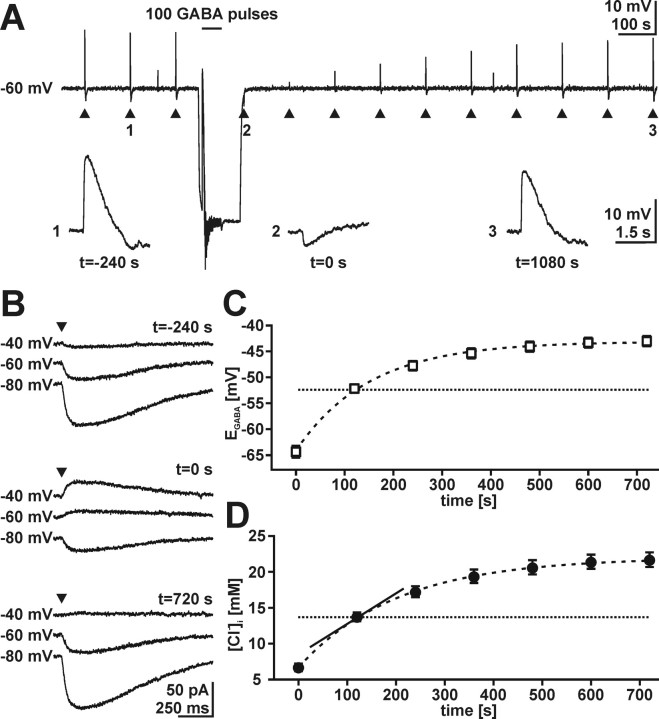
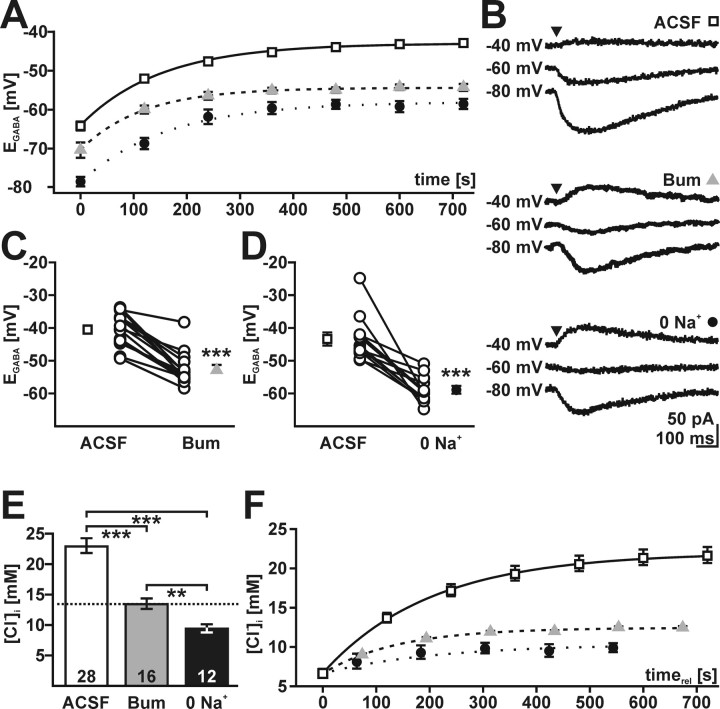
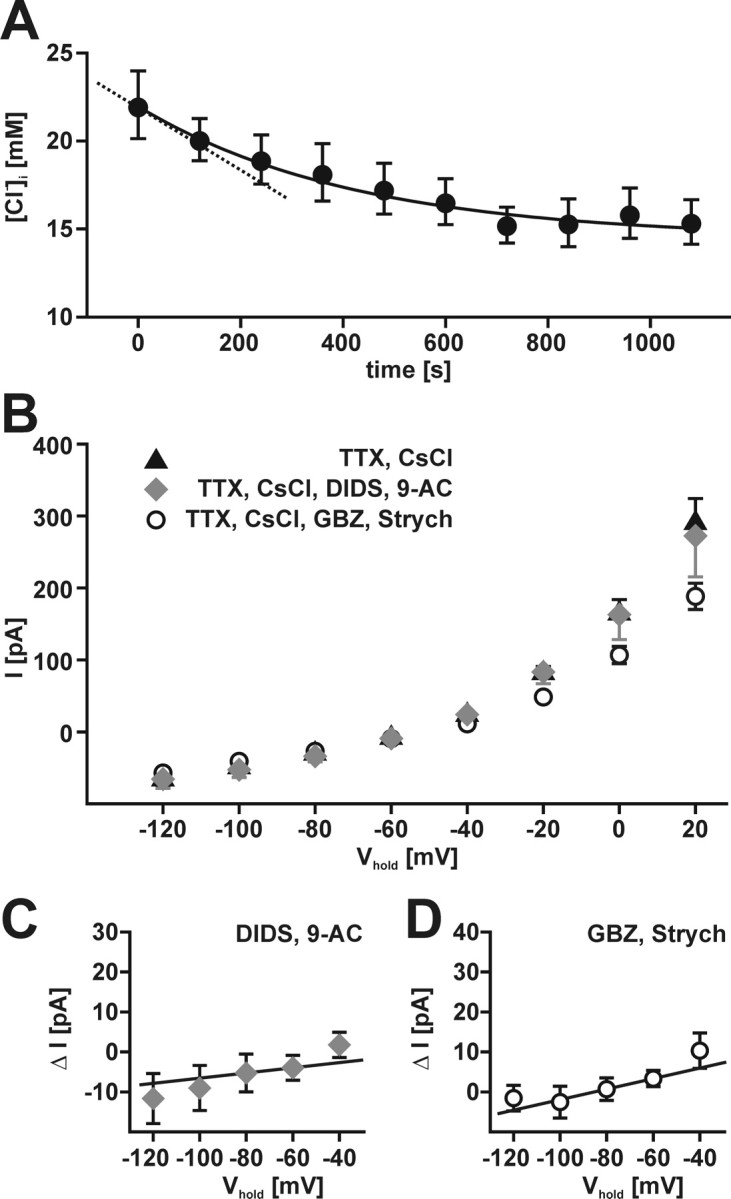
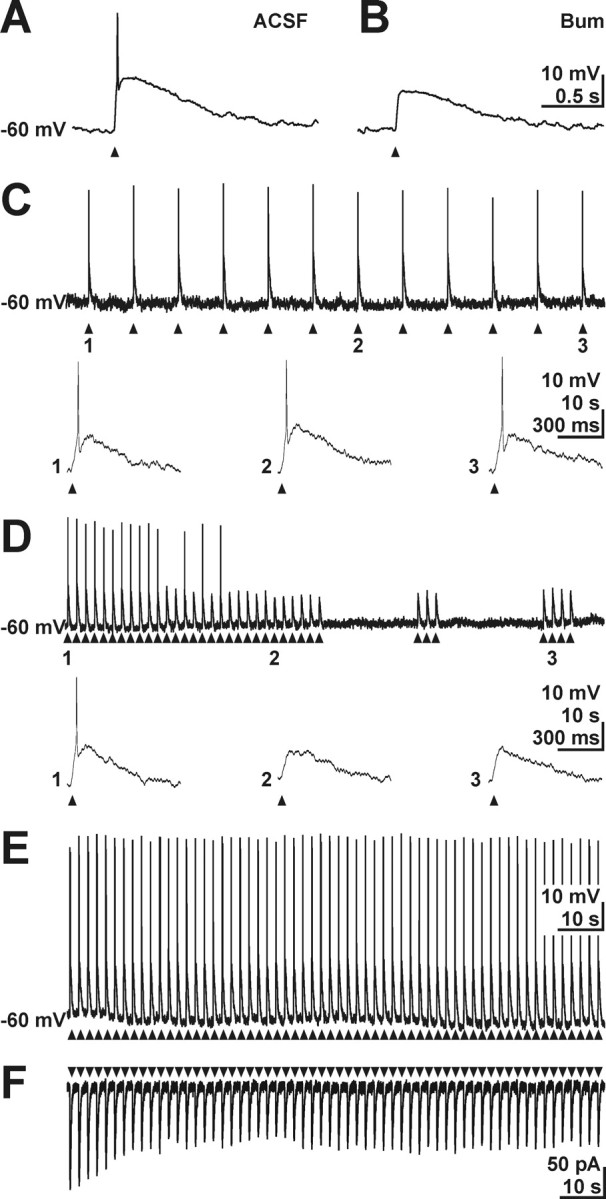
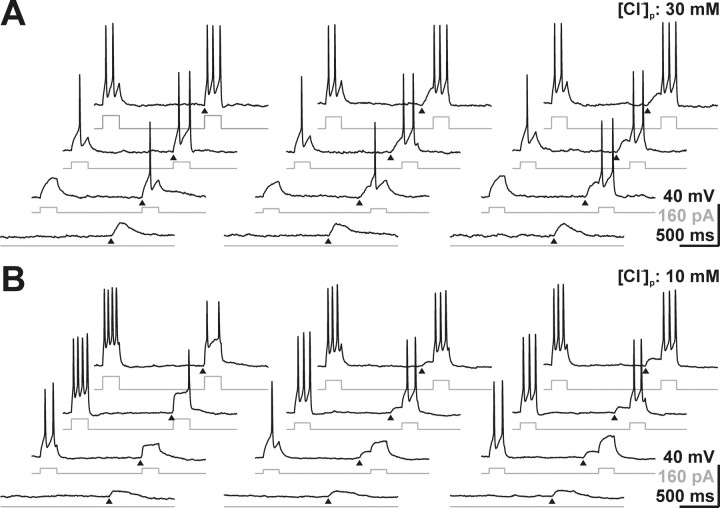
GABA, the main inhibitory neurotransmitter in the adult nervous system, evokes depolarizing membrane responses in immature neurons, which are crucial for the generation of early network activity. Although it is well accepted that depolarizing GABA actions are caused by an elevated intracellular Cl- concentration ([Cl-]i), the mechanisms of Cl- accumulation in immature neurons are still a matter of debate. Using patch-clamp, microfluorimetric, immunohistochemical, and molecular biological approaches, we studied the mechanism of Cl- uptake in Cajal-Retzius (CR) cells of immature [postnatal day 0 (P0) to P3] rat neocortex. Gramicidin-perforated patch-clamp and 6-methoxy-N-ethylquinolinium-microfluorimetric measurements revealed a steady-state [Cl-]i of approximately 30 mM that was reduced to values close to passive distribution by bumetanide or Na+-free solutions, suggesting a participation of Na+-K+-2Cl- cotransport isoform 1 (NKCC1) in maintaining elevated [Cl-]i. Expression of NKCC1 was found in CR cells on the mRNA and protein levels. To determine the contribution of NKCC1 to [Cl-]i homeostasis in detail, Cl- uptake rates were analyzed after artificial [Cl-]i depletion. Active Cl- uptake was relatively slow (47.2 +/- 5.0 microM/s) and was abolished by bumetanide or Na+-free solution. Accordingly, whole-cell patch-clamp recordings revealed a low Cl- conductance in CR cells. The low capacity of NKCC1-mediated Cl- uptake was sufficient to maintain excitatory GABAergic membrane responses, however, only at low stimulation frequencies. In summary, our results demonstrate that NKCC1 is abundant in CR cells of immature rat neocortex and that the slow Cl- uptake mediated by this transporter is sufficient to maintain high [Cl-]i required to render GABA responses excitatory.


Figures

Figure 1.
Figure 1.
Characterization of CR cells. A, Videomicroscopic image of a CR cell in a tangential slice preparation of a P1 rat. B, Immunolabeling of a CR cell in a tangential cortical slice preparation of a P0 rat. Although only the recorded CR cell was stained against biocytin (green), many reelin-positive (red) cells are visible in the tangential slice. The biocytin-labeled cell was reelin positive (merged picture). C, Electrophysiological properties of a CR cell recorded under gramicidin-perforated patch-clamp conditions. Depolarizing current injection elicited broad and repetitive action potentials, whereas injection of hyperpolarizing currents induced a prominent voltage sag. D, Electrophysiological properties of the CR cell shown in B recorded in whole-cell configuration. No difference was detected between whole-cell and perforated-patch measurements. E, Determination of resting membrane potential by the reversal potential of NMDA receptor channels recorded in cell-attached mode. Original traces (right) and corresponding amplitude histograms (left) of currents through NMDA receptor channels at different holding potentials are shown. Arrowheads mark the current amplitude of open channels. F, Current–voltage relationship of NMDA currents recorded in seven experiments. NMDA currents were reversed at −68 mV.
Figure 2.
Figure 2.
Methodical consideration for [Cl]i determination in gramicidin-perforated patch-clamp experiments. A, Typical GABA-evoked currents of P1 CR cells recorded in gramicidin-perforated patch-clamp configuration using two different pipette solutions containing either 6 mm Cl (low-Cl; left) or 136 mm Cl (high-Cl; right). GABA was applied focally (arrowhead) while holding potential (Vh) was adjusted between −100 and −20 mV in 20 mV steps. B, Current–voltage relationship of GABAergic currents (IGABA) recorded with low-Cl (closed circles) and high-Cl (open circles) pipette solution under gramicidin-perforated patch-clamp conditions. Data points represent means ± SEM of at least 18 experiments. The intersection of the linear fit and the x-axis indicates EGABA. C, Plot of EGABA obtained in all experiments using low-Cl (closed circles) and high-Cl (open circles) pipette solution under gramicidin-perforated patch-clamp conditions. Statistical analysis revealed that EGABA was identical using low Cl (closed square) or high Cl (open square) pipette solution. Box plots displaying median, top, and bottom quartile suggest a normal distribution of the data. D, Relationship between intervals of GABA application sequences and EGABA. EGABA was determined by the protocol shown in A at intervals between 15 and 120 s. Closed squares represent mean ± SEM of five experiments; the open square represents EGABA determined by the first application sequence. Note that EGABA was significantly (*p < 0.05; Wilcoxon test) reduced if the interval between application protocols is <120 s. E, Determination of EGABA (closed diamonds; n = 6) and GABA-induced peak depolarization (open diamonds; n = 4) with an interval of 2 min between application sequences performed at holding potentials of −60 mV. Both GABA responses were stable over the whole observation period.
Figure 3.
Figure 3.
Bumetanide sensitivity of [Cl]i in CR cells. A, GABAergic currents evoked at a holding potential of −80, −60, and −40 mV before and after the application of bumetanide. Note that EGABA was considerably shifted in a negative direction in the presence of 50 μm bumetanide. B, Representative traces of MEQ fluorescence of five CR cells identified by their morphological appearance in one tangential slice after removal of Cl and after addition of SCN. MEQ fluorescence was enhanced in Cl-free solution and was nearly completely quenched in the presence of SCN. C, Fluorescence ratio changes of CR cells after removal of Cl recorded under control conditions (thick lines) and after incubation in 100 μm bumetanide (thin lines). The initial fluorescence ratios, which correspond to resting [Cl]i, were lower in the bumetanide-incubated cells.
Figure 4.
Figure 4.
Expression of NKCC1 mRNA in CR cells. A, Bright-field microphotograph of a section from P0 cortex after in situ hybridization using antisense probes for NKCC1 showing the appearance of silver-grains close to the soma of large neurons in the marginal zone (MZ). CP, Cortical plate. B, Bright-field microphotograph of a section from P1 cortex after in situ hybridization using antisense probes for reelin. The intense signals close to the soma of large neurons in the MZ suggest that these neurons are CR cells. C, Ethidiumbromide-stained agarose gel with single-cell multiplex RT-PCR products of cytoplasm harvested from two CR cells. Primers for NKCC1, KCC2, ClC2, and β-actin were used. Note that signals for NKCC1, but also for KCC2 and ClC2, were found in CR cells.
Figure 5.
Figure 5.
Immunohistochemical identification of NKCC1 proteins in CR cells. A, Confocal image of NKCC1 immunoreactivity observed with T4 antibody in a tangential slice preparation. Note that large cells with CR cell-like morphology are NKCC1 immunopositive. B, Confocal image of reelin immunoreactivity observed with SP142 antibody in a tangential slice preparation. C–E, Confocal images of tangential slices immunostained simultaneously for NKCC1 (C) and reelin (D). The superimposed image (E) revealed that NKCC1 is expressed in all reelin-immunopositive neurons.
Figure 6.
Figure 6.
Cl accumulation in CR cells recorded under gramicidin-perforated patch-clamp conditions. A, Depletion protocol recorded in slow voltage-clamp mode. Arrowheads mark the focal application of a single GABA pulse. GABA pulses identified by numbers are displayed below the trace. Application of 100 GABA pulses at −100 mV reversed the direction of GABA responses recorded at −60 mV. The complete recovery process of GABAergic responses takes 18–20 min. The negative potential shifts after a GABA pulse were artifacts resulting from the slow voltage-clamp system. B, Voltage-clamp recordings of the typical protocol used to determine EGABA before (t = −240 s), directly after depletion (t = 0 s), and after recovery of [Cl]i (t = 720 s). C, Recovery process of EGABA after depletion protocol. Data points represent mean ± SEM of 26 experiments. The recovery process was slow, taking 10–15 min. The dashed line indicates EGABA of −52.4 mV, which corresponds to passive Cl distribution at −60 mV, considering a HCO3/Cl conductance of 0.2. D, Recovery of [Cl]i as calculated from the values shown in C. The dashed line indicates passive Cl distribution. The slope of the tangent (solid line) in this point is used to estimate the velocity of Cl accumulation (see Results for details).
Figure 7.
Figure 7.
Pharmacology of Cl accumulation. A, Recovery process of EGABA after depletion protocol under control conditions (open squares; n = 26), in Na+-free ACSF (filled circles; n = 7) and in the presence of 50 μm bumetanide (gray triangles; n = 10). The recovery process and final EGABA were altered by bumetanide and Na+-free ACSF. B, Typical responses to GABA application protocols used to determine EGABA after recovery in ACSF, 50 μm bumetanide (Bum), and Na+-free ACSF (0 Na+). C, Plot of EGABA determined after recovery in ACSF and subsequent recovery in 50 μm bumetanide. Individual experiments are shown as open circles connected by lines (mean ± SEM was calculated from 16 experiments). D, Plot of EGABA after recovery in ACSF and Na+-free ASCF. Mean ± SEM was calculated from 12 experiments. EGABA after recovery was significantly reduced (p < 0.001) by bumetanide and Na+-free ASCF. E, Effect of bumetanide and Na+-free conditions on [Cl]i. Error bars represent mean ± SEM of [Cl]i as calculated from EGABA shown in C and D. The number of experiments is shown in the bars, and the dashed line indicates passive Cl distribution. F, Recovery of [Cl]i calculated from the values depicted in A. Recovery curves are aligned to a [Cl]i of 6.6 mm (for details, see Results).
Figure 8.
Figure 8.
Cl conductance in CR cells. A, Decline of [Cl]i determined in gramicidin-perforated patch-clamp experiments after complete blockade of NKCC1 with 50 μm bumetanide. Circles represent mean ± SEM of six experiments. The maximal Cl efflux rate was calculated from the tangent aligned to the fit at the first data point (dashed line). B, Current–voltage relationship of membrane currents observed in the continuous presence of 0.2 μm TTX and 1 mm CsCl (black triangle). Although the combined application of the Cl channel blockers DIDS (375 μm) and 9-AC (1 mm) had little effect on membrane currents (gray diamonds), blockade of ligand-gated Cl channels with GBZ (3 μm) and strychnine (Strych; 30 μm) reduced membrane currents at depolarized potentials (open circle). C, IV plot of current difference (ΔI) between control and 9-AC/DIDS containing bathing solutions. Slope Cl conductance was estimated between −80 and −60 mV. D, IV plot of current difference (ΔI) between control and GBZ/strychnine containing bathing solutions. Slope Cl conductance was estimated between −80 and −60 mV.
Figure 9.
Figure 9.
Effect of active Cl uptake on GABA responses in CR cells. A, Gramicidin-perforated patch-clamp recording of a CR cell. Focal GABA application (arrowheads) elicited APs. B, In the same cell, 50 μm bumetanide suppressed GABA-induced AP. C, Repetitive GABA pulses (arrowheads) at a frequency of 0.1 Hz reliably elicited APs at each application under perforated-patch conditions. Events indicated by numbers are shown at a larger time scale below the current trace. D, Subsequent increase in application frequency to 0.5 Hz attenuated the amplitude of GABA responses and abolished AP (2). The amplitude of GABA-induced depolarization increased slightly after cessation of repetitive application, but no AP could be elicited (3). E, Current-clamp recording of GABA responses under whole-cell conditions at a [Cl]p of 30 mm. Under whole-cell conditions, GABA application at a frequency to 0.5 Hz reliably evoked APs. F, Voltage-clamp recording of GABA responses under whole-cell conditions at a [Cl]p of 30 mm. Repetitive application at a frequency to 0.5 Hz led to a partial desensitization of GABAergic inward currents.
Figure 10.
Figure 10.
Facilitating and shunting actions of GABA in CR cells. Whole-cell recordings of membrane potential (black traces) in response to current injection of increasing intensities (gray traces). Current pulses were injected simultaneously with the GABA application (left traces), at the peak (middle traces), or in the decaying phase (right traces) of the GABA-induced membrane depolarization (triangles). A, At a [Cl]p of 30 mm, GABA decreased the threshold current to evoke APs, independent of the timing between current injection and GABA application. In addition, the number of APs increased, compared with current injection without GABA application. B, At a [Cl]p of 10 mm, GABA increased the threshold current to evoke APs and decreased the number of APs independent of the timing between current injection and GABA application.

Similar articles

Cited by

References

    1. Achilles K, Okabe A, Ikeda M, Shimizu-Okabe C, Fukuda A, Luhmann HJ, Kilb W. Excitatory GABA actions in Cajal-Retzius cells are mediated by NKCC1. FENS Abstr. 2006;3:A1118–1.
    1. Alvarez-Leefmans FJ, Gamino SM, Giraldez F, Nogueron I. Intracellular chloride regulation in amphibian dorsal root ganglion neurones studied with ion-selective microelectrodes. J Physiol (Lond) 1988;406:225–246. - PMC - PubMed
    1. Aronson PS. Kinetic properties of the plasma membrane Na+-H+ exchanger. Annu Rev Physiol. 1985;47:545–560. - PubMed
    1. Balakrishnan V, Becker M, Lohrke S, Nothwang HG, Guresir E, Friauf E. Expression and function of chloride transporters during development of inhibitory neurotransmission in the auditory brainstem. J Neurosci. 2003;23:4134–4145. - PMC - PubMed
    1. Ballanyi K, Grafe P. An intracellular analysis of gamma-aminobutyric-acid-associated ion movements in rat sympathetic neurones. J Physiol (Lond) 1985;365:41–58. - PMC - PubMed

Publication types

MeSH terms

Substances

LinkOut - more resources