Comparative Study
. 2007 Aug 8;27(32):8643-53.
doi: 10.1523/JNEUROSCI.5284-06.2007.

Local and global effects of I(h) distribution in dendrites of mammalian neurons

Affiliations
Comparative Study

Local and global effects of I(h) distribution in dendrites of mammalian neurons

Kamilla Angelo et al. J Neurosci. .

Abstract

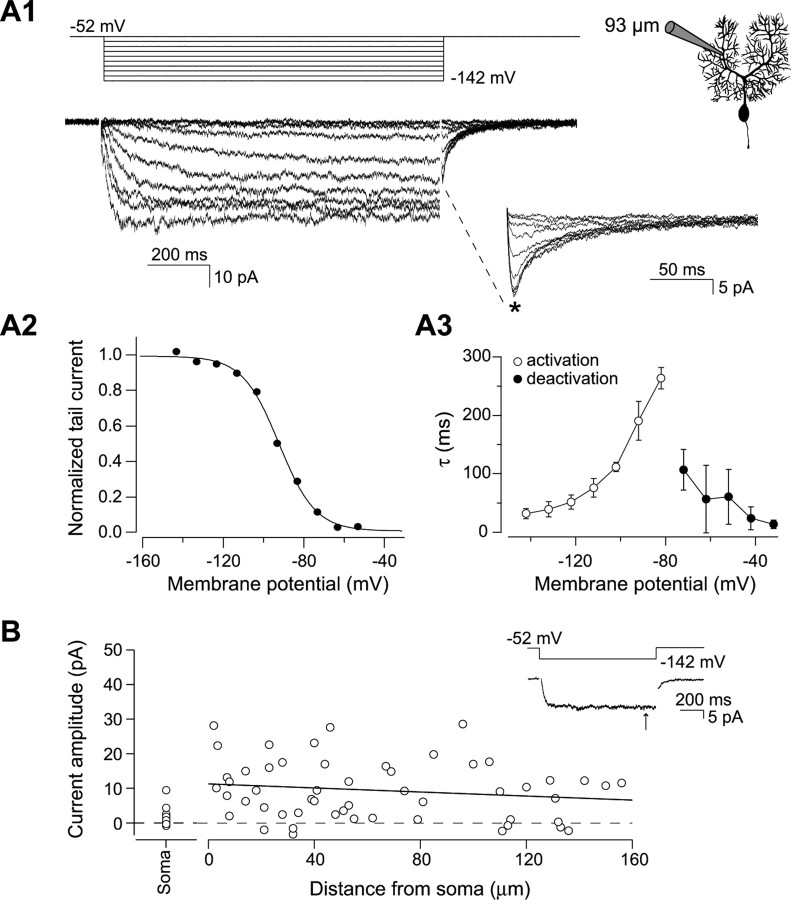
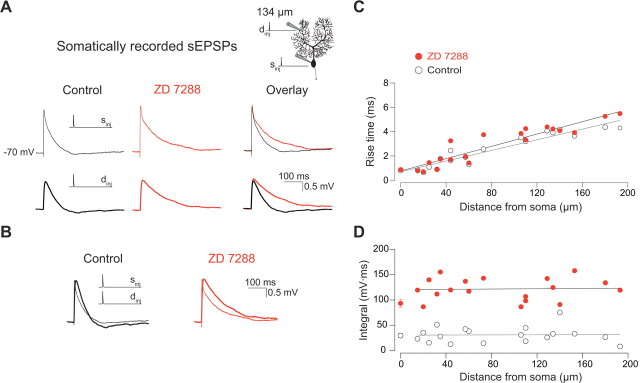
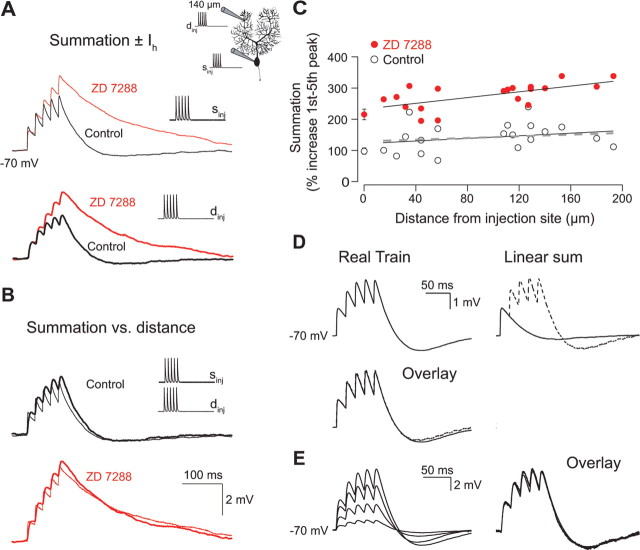
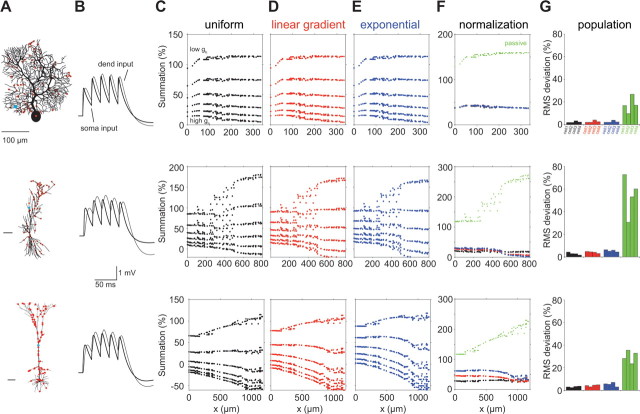
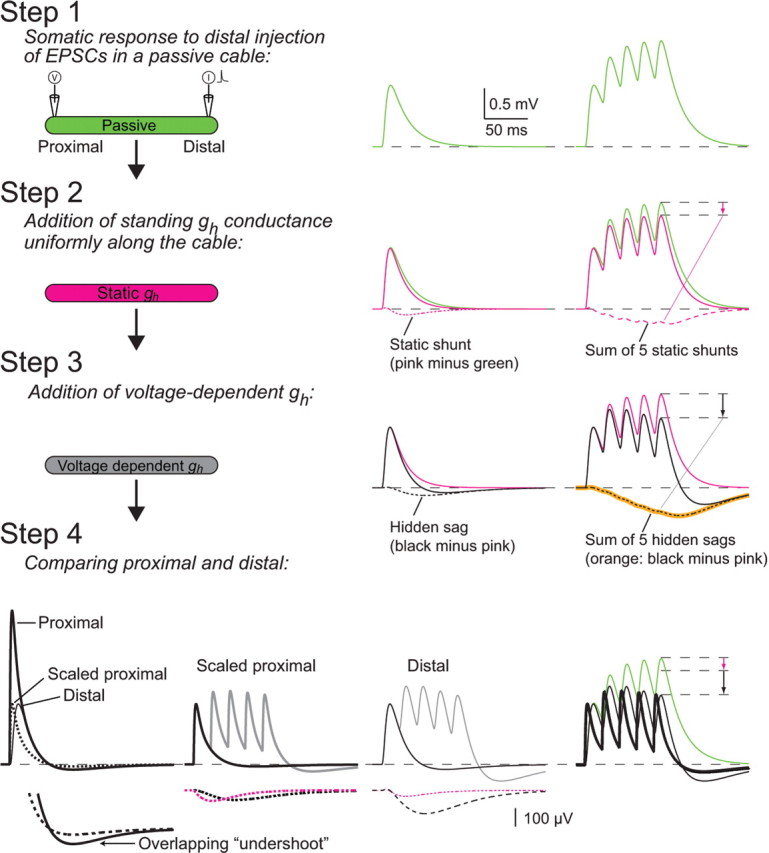
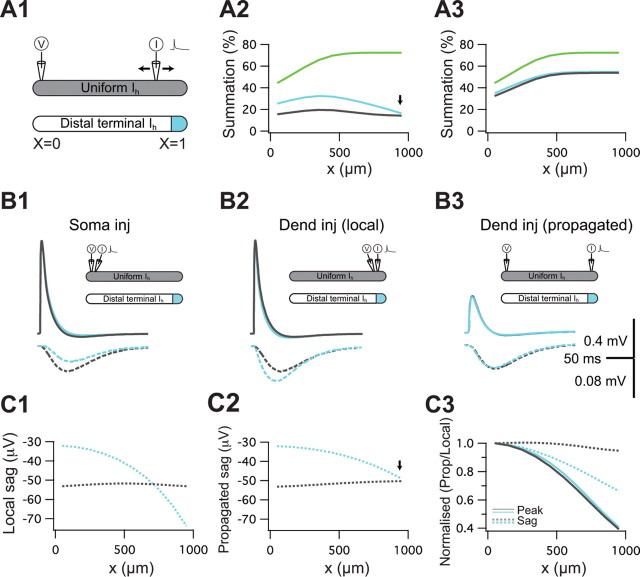
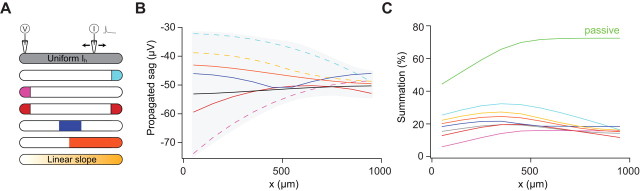
The hyperpolarization-activated cation current I(h) exhibits a steep gradient of channel density in dendrites of pyramidal neurons, which is associated with location independence of temporal summation of EPSPs at the soma. In striking contrast, here we show by using dendritic patch-clamp recordings that in cerebellar Purkinje cells, the principal neurons of the cerebellar cortex, I(h) exhibits a uniform dendritic density, while location independence of EPSP summation is observed. Using compartmental modeling in realistic and simplified dendritic geometries, we demonstrate that the dendritic distribution of I(h) only weakly affects the degree of temporal summation at the soma, while having an impact at the dendritic input location. We further analyze the effect of I(h) on temporal summation using cable theory and derive bounds for temporal summation for any spatial distribution of I(h). We show that the total number of I(h) channels, not their distribution, governs the degree of temporal summation of EPSPs. Our findings explain the effect of I(h) on EPSP shape and temporal summation, and suggest that neurons are provided with two independent degrees of freedom for different functions: the total amount of I(h) (controlling the degree of temporal summation of dendritic inputs at the soma) and the dendritic spatial distribution of I(h) (regulating local dendritic processing).


Figures

Figure 1.
Figure 1.
Properties and distribution of Ih in Purkinje cells. A1, Ih recorded in a dendritic cell-attached patch-clamp recording 93 μm from the soma. The patch was held at −52 mV and hyperpolarized for 1 s in steps of 10 mV from −52 to −142 mV. Tail currents evoked by stepping back to −52 mV for 200 ms are expanded. A2, Activation curve of the Ih current in A1. The peak tail currents (*) are normalized to the top plateau of a Boltzmann function. The solid line represents a sigmoidal fit to the data points giving a midpoint of activation at −91.1 mV with a slope constant of −9.1 mV (sigmoidal fit to the mean ± SEM of 5 recordings: V1/2 = −90.3 mV, slope constant = −9.7 mV). A3, Time constants of Ih activation and deactivation. The time constants were obtained by fitting single exponentials to traces in which the Ih current is activated from the closed state or deactivated from a maximally open state at potentials between −142 and −82 mV (open) and between −72 and −52 mV (filled), respectively (n = 5). B, Distribution of Ih along the soma–dendritic axis. The steady-state Ih amplitudes from full activation of the current at −142 mV (inset, arrow) are plotted as a function of distance from the soma (n = 53 cell-attached patches). A straight line with a slope of −3 pA/100 μm is fitted to the data points.
Figure 2.
Figure 2.
Effect of Ih on single sEPSP waveforms. A, Somatic sEPSP traces from a simultaneous dendritic and somatic current-clamp recording (see inset). sEPSPs were evoked by injection of an EPSC-like double-exponential waveform (τrise = 0.3 ms; τdecay = 3 ms; 500 pA). Control and ZD 7288 traces from the same experiment are overlaid to allow for a direct comparison of the shape of the sEPSPs with and without Ih. The thin and thick lines represent responses to somatic and dendritic current injections, respectively. B, The propagated sEPSP from injection at the dendritic location (134 μm) was superimposed and scaled to the peak of the sEPSP from injection at the soma to show the effect of distance on the PSPs. Waveforms in both the control situation (open) and after application of ZD 7288 (red) are presented. The rise time (C) and integral (D) of somatic sEPSPs are plotted as a function of distance from the injection site. The data points at the soma are the mean ± SEM of 7–20 recordings including 3–5 double somatic recordings.
Figure 3.
Figure 3.
Effect of Ih on summation of sEPSPs. A, Representative somatic sEPSP traces from injection of five EPSC-like waveforms at a frequency of 50 Hz in the presence and absence of ZD 7288. The control and ZD 7288 traces from the same recording are overlaid according to injection site (somatic or dendritic). The thin and thick lines represent responses to somatic and dendritic current injections, respectively. This comparison directly shows the effect of Ih on summation for the two injection sites. B, The somatic voltage response from a dendritic injection at 140 μm from the soma was scaled to peak of and superimposed on the voltage response from a somatic injection. Note the small effect of distance on summation both in control and in ZD 7288. C, Pooled data from experiments performed according to the experiment in A. The dendritic pipette was positioned at different locations on the dendritic tree up to a maximum of 190 μm from the soma. The summation recorded with the somatic pipette is plotted as a function of distance from the injection site. The open and red markers represent control and ZD 7288 data points, respectively. A straight line has been fitted to each dataset for the dendritic inputs. The data points at the soma represent the mean ± SEM of 15–17 recordings including three to four double somatic experiments. Values of summation were calculated from the control sEPSPs in Figure 2D assuming linear summation. The dashed line on the plot represents the result of linear regression to the predicted data. D, Linearity of sEPSP summation. Somatic voltage trace from somatic injection of five consecutive waveforms at 50 Hz (real train). The response to an individual EPSC waveform injection was recorded from the same cell and the linear sum of five single sEPSPs was subsequently calculated (---). The overlay demonstrates that the linear sum matches the recorded train. E, Scaling of summation. Superimposed somatic responses to sEPSP trains with first EPSC amplitudes of 0.2, 0.6, 1.0, and 1.4 nA. Scaling the 0.2 nA injection to the 1.4 nA injection shows the amplitude independence of the temporal summation.
Figure 4.
Figure 4.
The effect of Ih spatial distribution and density on temporal summation in models of dendritic neurons with realistic morphology. Three dendritic morphologies: cerebellar Purkinje cell (top row), CA1 pyramidal (middle row), and cortical layer 5 pyramidal neurons (bottom row) were modeled with uniform (C), linear gradient (D), and exponential (E) distributions of gh conductance (see Materials and Methods). Scale bar, 100 μm. For each cell type, we started with gh = 0.00005 S/cm2 and repeated the simulation 12 times (only 6 densities are depicted), each time gradually increasing the density by 0.00003 S/cm2 (C, top: low density to high density). For each of the neurons and each of the profiles of spatial distributions, there exists a density that results in location-independent temporal summation. B compares the voltage response at the soma for a somatic and dendritic current injection (cyan spots in A) for case of a uniform distribution shown in F. F shows the temporal summation for the Ih density for which the uniform distribution shows the best location independence of temporal summation (black). Also depicted are the summation for the linear gradient (red) and the exponential (blue) with the same average gh and the case in which Ih is absent (passive; green). In G, we quantify the degree of normalization for 12 neurons (4 of each type). For each distribution, we pick the optimal density for normalization and plot the SD of the summation (expressed as root mean square deviation) for this case. Colors are as in other panels.
Figure 5.
Figure 5.
The mechanisms underlying normalization of temporal summation by Ih. Step 1, We compared the responses to a single input (double exponential current with τrise = 0.3 ms and τdecay = 3 ms) (left panel) and a train of five consecutive inputs at 50 Hz (right panel) at a distal location (x = 0.9 λ) on a passive cylinder of unit electrotonic length (Rm = 20,000 Ωcm2; Ri = 200 Ωcm; d = 4 μm; l = 1000 μm), recorded at the proximal location (X = 0) (see inset). Step 2, A uniform gh conductance was added (0.00011 S/cm2) [see Materials and Methods and supplemental Fig. 1 (available at www.jneurosci.org as supplemental material)]. The open conductance at an initial potential of −70 mV was computed (0.000012 S/cm2), and the conductance was fixed to that value during the whole simulation. The current injections at step 1 were repeated, and the response (pink line) was recorded at the proximal location. By subtracting the response in step 1 (green) from the response in step 2 (pink), we obtain the static shunt (dashed pink). Note that this is a small, but slow effect, and thus it summates more than the peak of the sEPSPs (arrow, right panel). Step 3, The constraint on Ih was released and the same simulation was repeated with voltage-dependent Ih (compare with control in the experiments). By subtracting the resulting sEPSPs (black) from those of step 2 (pink), we obtain the hidden sag, the net effect of the voltage-sensitive action of Ih (dashed black line), which is also slow and exhibits significant summation (black arrow). This analysis depends on Ih behaving linearly (Fig. 3D,E; supplemental Figs. 1, 2, available at www.jneurosci.org as supplemental material), and indeed we can predict the hidden sag of the train by a linear sum of the hidden sags associated with a single sEPSP (overlay of dashed black and orange lines in the right panel). Step 4, The voltage response in the proximal location is compared (in control conditions) for proximal and distal current injections (left panel). The peak response for the distal input is greatly attenuated; however, the undershoot of the distal response is identical to the proximal (see enlarged “overlapping undershoot,” left panel, bottom). This indicates that the sag and the peak of the response are filtered differentially by the cable. When the current amplitude at the proximal location is decreased to equalize the peaks (left panel, dashed, “scaled proximal”), the static shunt and hidden sag (from steps 2 and 3) for the distal injection are both larger than for the proximal input (middle panels, bottom, dashed traces; note enlarged scale). When comparing the summation of a train from a distal and proximal inputs, the joint effect of larger summation of small but slow sag signals and the larger sags for the distal locations, leads to similar reduction in temporal summation for both distal and proximal inputs.
Figure 6.
Figure 6.
Differential filtering of peak and sag for different spatial distributions. A1, Two models were used, a cylinder with uniform gh (identical to the model in Fig. 5), and a nonuniform model, identical to the uniform model, with the exception that the total amount of gh was concentrated in the distal compartment. A2, The degree of temporal summation of five inputs measured at the proximal end of the cylinder (X = 0) in the control (uniform) and the nonuniform distribution models as a function of input location along the cylinder. Also depicted is the passive case (green). A3, The degree of temporal summation in the corresponding “static Ih” cases (as described in Fig. 5, step 2). B1 depicts the sEPSP measured in the proximal terminal in response to current injection at the same proximal location for both the uniform (solid black) and nonuniform (solid blue) distributions. Also shown are the corresponding hidden sags (dashed). B2, The local voltage response when the current is injected in the distal terminal. Again, the local hidden sag is also shown. B3, Propagated sEPSP and hidden sags when current is injected distally and voltage recorded proximally. C1 depicts the peak amplitude of the local hidden sag (see B2) as a function of input location. C2, The propagated hidden sag (example in B3). Same as C1, only the voltage response was measured at X = 0. C3, Comparison of the attenuation of voltage peak (solid lines) and hidden sag (dashed lines) for the two distributions as a function of input location. Peak attenuation was computed as the peak amplitude of the propagated voltage response divided by the local amplitude. Similarly sag attenuation is the amplitude of the propagated sag divided by the local sag.
Figure 7.
Figure 7.
Bounds on the hidden sag and temporal summation for different spatial distributions. A, Seven cylinder models with different spatial distributions of gh. As in previous figures, all models have the same total amount of gh. B, The propagated hidden sag is shown as a function of input location in the different models. The traces are color-coded as in A. The distributions (as appear in top to bottom in A) are as follows: (1) uniform gh as in Figure 6, (2) 100% of gh at X = 1, (3) 100% of gh at X = 0, (4) 50% of gh at X = 0 and 50% at X = 1, (5) gh is concentrated in the two middle compartments of the cylinder, (6) gh = 0 on the left half of the cylinder and equals 0.00022 S/cm2 (twice the value of the uniform case) on the other half, and (7) gh follows a linear gradient with distance from X = 0 such that gh(0) = 0 and gh(1) = 0.00022 S/cm2 (again twice as much as in the uniform case). The gray area marks the range of propagated hidden sag amplitude from any distribution (for details, see supplemental Fig. 3, available at www.jneurosci.org as supplemental material). C, The corresponding profile of temporal summation (5 inputs at 50 Hz) at X = 0 for all of the above models.

Similar articles

Cited by

References

    1. Azene EM, Xue T, Li RA. Molecular basis of the effect of potassium on heterologously expressed pacemaker (HCN) channels. J Physiol (Lond) 2003;547:349–356. - PMC - PubMed
    1. Berger T, Larkum ME, Lüscher HR. High Ih channel density in the distal apical dendrite of layer V pyramidal cells increases bidirectional attenuation of EPSPs. J Neurophysiol. 2001;85:855–868. - PubMed
    1. Berger T, Senn W, Lüscher HR. Hyperpolarization-activated current Ih disconnects somatic and dendritic spike initiation zones in layer V pyramidal neurons. J Neurophysiol. 2003;90:2428–2437. - PubMed
    1. BoSmith RE, Briggs I, Sturgess NC. Inhibitory actions of ZENECA ZD7288 on whole-cell hyperpolarization activated inward current (If) in guinea-pig dissociated sinoatrial node cells. Br J Pharmacol. 1993;110:343–349. - PMC - PubMed
    1. Bullis JB, Jones TD, Poolos NP. Reversed somatodendritic I(h) gradient in a class of rat hippocampal neurons with pyramidal morphology. J Physiol (Lond) 2007;579:431–443. - PMC - PubMed

Publication types

MeSH terms

Substances

LinkOut - more resources