Comparative Study
. 2007 Aug 8;27(32):8719-32.
doi: 10.1523/JNEUROSCI.1630-07.2007.

Dendritic HCN2 channels constrain glutamate-driven excitability in reticular thalamic neurons

Affiliations
Comparative Study

Dendritic HCN2 channels constrain glutamate-driven excitability in reticular thalamic neurons

Shui-Wang Ying et al. J Neurosci. .

Abstract

Hyperpolarization activated cyclic nucleotide (HCN) gated channels conduct a current, I(h); how I(h) influences excitability and spike firing depends primarily on channel distribution in subcellular compartments. For example, dendritic expression of HCN1 normalizes somatic voltage responses and spike output in hippocampal and cortical neurons. We reported previously that HCN2 is predominantly expressed in dendritic spines in reticular thalamic nucleus (RTN) neurons, but the functional impact of such nonsomatic HCN2 expression remains unknown. We examined the role of HCN2 expression in regulating RTN excitability and GABAergic output from RTN to thalamocortical relay neurons using wild-type and HCN2 knock-out mice. Pharmacological blockade of I(h) significantly increased spike firing in RTN neurons and large spontaneous IPSC frequency in relay neurons; conversely, pharmacological enhancement of HCN channel function decreased spontaneous IPSC frequency. HCN2 deletion abolished I(h) in RTN neurons and significantly decreased sensitivity to 8-bromo-cAMP and lamotrigine. Recapitulating the effects of I(h) block, HCN2 deletion increased both temporal summation of EPSPs in RTN neurons as well as GABAergic output to postsynaptic relay neurons. The enhanced excitability of RTN neurons after I(h) block required activation of ionotropic glutamate receptors; consistent with this was the colocalization of HCN2 and glutamate receptor 4 subunit immunoreactivities in dendritic spines of RTN neurons. The results indicate that, in mouse RTN neurons, HCN2 is the primary functional isoform underlying I(h) and expression of HCN2 constrains excitatory synaptic integration.


Figures
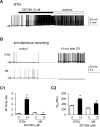
Figure 1.
Figure 1.
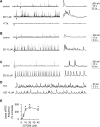
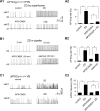
Blockade of HCN channels increases the spike firing rate in RTN, but not VB, neurons. A, Application of the HCN channel blocker ZD7288 increases spontaneous action potential (AP) firing in an RTN neuron. The value to the left of the trace indicates membrane potential level (in millivolts) in this and subsequent figures. B, Simultaneous recordings of an RTN and VB neuron demonstrate that ZD7288 affects action potential firing in a nucleus-specific manner. Representative traces show firing activity before (left) and 10 min (right) after ZD7288 (10 μm) application. ZD7288 increased action potential firing in the RTN neuron but decreased it in the VB neuron. The thin dotted line indicates the level of the membrane potential at the start of the first trace; note the small depolarization in the membrane potential in the RTN neuron compared with the small hyperpolarization observed in the VB neuron. Bicuculline (10 μm) was present in the extracellular solution during simultaneous recordings to prevent rebound burst firing. C1, Bar graph summarizing effect of ZD7288 on firing rate (hertz). *p < 0.05 (paired t test), 10 μm ZD7288 versus control (0 μm); n = 22 for RTN, n = 10 for VB. Data pooled from experiments described in A and B. C2, Bar graph summarizing effects of ZD7288 on Rin; same pooled data as C1.
Figure 2.
Figure 2.
Blockade of HCN channels increases frequency of large-amplitude IPSCs in VB neurons. A, Control sIPSCs were recorded from a VB neuron; ZD7288 (ZD) at 5 μm increases the sIPSC frequency, and addition of TTX (1 μm) abolishes all large sIPSCs, indicating that these large sIPSCs are action potential dependent. Representative events (marked by arrows) are expanded on the right in this and the following panels. Timescale: 10 s for traces on left; 0.1 s for expanded traces (right). B, C, ZD7288 at 10 μm (B) and 20 μm (C) further increases large sIPSC frequency in different neurons. Timescale: 10 s for traces on left; 0.2 s for B; and 0.4 s for C, respectively, for expanded traces (right). D, In a different neuron than above, mIPSCs are recorded in the presence of TTX (1 μm) followed by TTX plus ZD7288 (10 μm). Note the different scales for amplitude and time: 80 pA, 0.2 s here versus 800 pA, 0.1 s in A. E, Grouped data demonstrate that ZD7288 increases the large sIPSC frequency in a concentration-dependent manner. Frequency (hertz) at indicated ZD7288 concentrations were as follows (corresponding control values provided at each concentration): 1 μm, 2.96 ± 0.18 (2.56 ± 0.19); 5 μm, 5.14 ± 0.52 (2.46 ± 0.27); 10 μm, 9.67 ± 1.24 (2.23 ± 0.25); 20 μm, 12.97 ± 1.69 (2.56 ± 0.24); 40 μm, 9.71 ± 1.4 (2.25 ± 0.29). *p < 0.05 versus control.
Figure 3.
Figure 3.
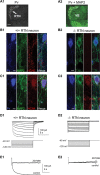
HCN2 is the major isoform that generates Ih in RTN neurons. A1, Low-magnification confocal microscopy image shows immunofluorescence for parvalbumin (Pv; white) labeling RTN neurons in the thalamus. Scale bars: A1, 200 μm; B1, C1, 5 μm. A2, MAP2 expression (green) is present in parvalbumin-positive GABAergic neurons, as assessed by double immunofluorescence. B1, High-magnification images show triple-immunofluorescent labeling for parvalbumin (blue), MAP2 (green), and HCN2 (red) in a +/+ RTN neuron. Note that very little HCN2-IR is present on the RTN cell body densely labeled with parvalbumin. In the merged image, there is no apparent colocalization between HCN2-IR and MAP2-IR. B2, HCN2 immunolabeling is absent in −/− RTN neurons. C1, Immunostaining with antibodies against HCN4 shows prominent somatic labeling in the +/+ RTN neuron. C2, A similar HCN4 expression pattern is seen in a −/− RTN neuron. Merged images demonstrate that labeling for HCN4 and MAP2 does not overlap in +/+ (C1) and −/− (C2) RTN neurons. D1, D2, Whole-cell voltage-clamp recordings show a family of current traces recorded from a +/+ RTN neuron (D1); the voltage protocol is shown below. HCN2 deletion (D2) eliminates Ih currents in the RTN neuron. E1, E2, Exemplar current traces in response to a 20-s-long voltage step to −110 mV (from −40 mV; protocol not shown) in +/+ (E1) and −/− (E2) RTN neurons. A ZD7288-sensitive current is readily detected in the +/+, but not −/−, RTN neuron.
Figure 4.
Figure 4.
HCN2 deletion increases GABAergic output from RTN to VB and abolishes sensitivity to ZD7288. A, sIPSCs are recorded from a −/− VB neuron. ZD7288 (10 μm) fails to affect sIPSC frequency, and addition of TTX (1 μm) eliminates all large sIPSCs in the same neuron. sIPSCs marked by solid bars are expanded on right. Calibration: 500 pA for all traces; 8 s and 0.5 s for traces on left and right, respectively. B, Bar graph summarizing effects of ZD7288 and comparison of large sIPSC frequency between +/+ and −/− VB neurons. *p < 0.05, 10 μm ZD7288 versus control (0 μm) in +/+ VB neurons (n = 20). +p < 0.05, control in +/+ versus control in −/− VB neurons (n = 20).
Figure 5.
Figure 5.
HCN2 in RTN restrains GABAergic output. A1, In an HCN2 +/+ VB neuron, enhancing HCN channel function by 8-Br-cAMP (200 μm) superfusion decreases large sIPSC frequency, but this effect is absent in a −/− VB neuron. Recordings for control (predrug) and 8-Br-cAMP are made from the same neuron. Traces for washout are not shown. A2, Bar graph indicates shows that 8-Br-cAMP reversibly reduces large sIPSC frequency in +/+, but not −/−, VB neurons. For +/+ neurons, sIPSC frequency (hertz) was as follows: control, 2.84 ± 0.24; 8-Br-cAMP, 1.02 ± 0.09; and washout, 2.56 ± 0.22. For −/− neurons, sIPSC frequency was as follows: control, 7.27 ± 0.47; 8-Br-cAMP, 6.39 ± 0.41; and washout, 6.55 ± 0.42. *p < 0.05 versus control, n = 8 each. B1, B2, Another HCN channel modulator lamotrigine (LTG; 50 μm) also decreases large sIPSC frequency in +/+, but not HCN −/−, VB neurons (B1). B2, For +/+ neurons, sIPSC frequency (hertz) was as follows: control, 2.54 ± 0.27; lamotrigine, 0.79 ± 0.08; and washout, 2.35 ± 0.32. For −/− neurons, sIPSC frequency was as follows: control, 8.38 ± 1.14; lamotrigine, 7.36 ± 1.0; and washout, 7.55 ± 1.03. *p < 0.05 versus control, n = 8. Traces for control and LTG are from the same neuron.
Figure 6.
Figure 6.
Potassium channel blockers do not occlude the effects of ZD7288 in RTN neurons. A, Bath application of Ba2+ depolarizes the membrane potential, and addition of ZD7288 dramatically increases firing in the same +/+ neuron. Representative firing activities marked by arrows are expanded at bottom. The thin dotted line indicates the level of the membrane potential at the start of the first trace. Timescale: 3 min for top traces; 400 ms for expanded traces. B, Application of the TASK channel blocker bupivacaine followed by addition of ZD7288 markedly increases firing. C, Application of the SK channel blocker dequalinium does not occlude the response to ZD7288. D, Bar graph summarizing effects of ZD7288 (ZD) on firing rate in the presence of Ba2+, bupivacaine (Bup), and dequalinium (Deq), respectively. *p < 0.05 versus control, one-way ANOVA; n = 10 each.
Figure 7.
Figure 7.
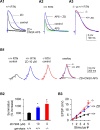
HCN2 constrains ionotropic glutamate receptor-mediated excitatory synaptic responses in RTN neurons. A1, Ionotropic glutamatergic EPSPs were evoked (for details, see Materials and Methods) in the presence of bicuculline and 2-OH-saclofen in a +/+ RTN neuron at −75 mV. ZD7288 (ZD; 10 μm) was added by bath perfusion. The evoked EPSPs could be blocked by CNQX (20 μm) and AP-5 (40 μm). A2, EPSPs mediated by AMPA receptors were isolated by the further addition of AP-5 in a +/+ RTN neuron; ZD7288 (10 μm) was applied by bath perfusion. A3, Comparison of EPSPs in ZD7288 from the same neuron in A1 and from a −/− RTN neuron. B1, A train of EPSPs are evoked in a +/+ RTN neuron by extracellular stimulation of the internal capsule (a train of 5 pulses, 33 Hz, 0.15 ms, every 15 s) in control (no drug) and the presence of ZD7288. In a −/− RTN neuron, EPSPs are evoked in the absence of ZD7288, using the same stimulus protocol. The overlay shows the similarity of −/− EPSPs with +/+ EPSPs in the presence of ZD. Each trace is an average of at least five sweeps. B2, Bar graph for grouped data show percentage increase in EPSP summation in both +/+ and −/− RTN neurons. *p < 0.05, ZD7288 (10 μm) versus control (0 μm) in +/+ neurons; +p < 0.05, control +/+ versus control −/−; n = 10 each. B3, Plot shows the progressive increase of EPSP amplitude in response to a train of five pulses. Note that the slope of the regression line is shallower in the +/+ control group than in the other two groups.
Figure 8.
Figure 8.
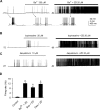
Blockade of ionotropic glutamate receptors attenuates response to ZD7288. A1, Preblockade of ionotropic glutamatergic receptors markedly attenuates excitatory effects of ZD7288 (ZD) on spike firing in RTN neurons. Representative segments of the voltage trace show spike firing in control (no drug; top left) and bath application of ZD7288 (20 μm) alone (top right) in an RTN neuron. The membrane potential (in millivolts; indicated at left) is the average membrane potential between spikes (here and in B1). Note the depolarization in the membrane potential after superfusion of ZD7288. Traces below (in a different neuron than above) show firing in the presence of bath-applied AP-5 (40 μm) plus CNQX (20 μm) and followed by AP-5 plus CNQX plus ZD7288 (20 μm). A2, Bar graph summarizing the effects of bath-applied ZD7288 on spike firing rate in the absence or presence of AP-5 plus CNQX in RTN neurons. *p < 0.05, one-way ANOVA; n = 8 per group (in which “group” is without or with AP-5 plus CNQX). B1, Representative traces demonstrating spike firing in a different RTN neuron than in A. Here ZD7288 (20 μm) was present in the recording pipette solution; the first trace (top left) shows spike firing within the first 2 min after obtaining whole-cell configuration, and firing is markedly increased 15 min later (top right). Again, there is a small depolarization in the membrane potential in the presence of ZD7288. Bath application of AP-5 plus CNQX for 5 min markedly decreased spike firing (bottom left); after AP-5 plus CNQX washout (10 min), firing activity recovered (bottom right). Times indicated are relative to seal rupture. B2, Bar graph summarizing the effects of intracellularly applied ZD7288 on spike firing rate before and after AP-5 plus CNQX superfusion in RTN neurons. The effect of ZD7288 on spike firing was markedly reduced by AP-5 plus CNQX application. *p < 0.05, one-way ANOVA; n = 14 cells. C1, Preapplication of AP-5 plus CNQX markedly attenuated the effects of ZD7288 on the frequency of large (>100 pA) sIPSCs in VB neurons. C2, Bar graph summarizing the effects of bath-applied ZD7288 on large sIPSC frequency in the absence or presence of AP-5 plus CNQX in VB neurons. *p < 0.05, one-way ANOVA; n = 10 per group (as defined in A2).
Figure 9.
Figure 9.
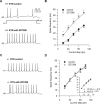
HCN2 deletion abolishes effects of ZD7288 on tonic spike firing in RTN neurons. A, Representative traces demonstrating tonic spike firing initiated by intracellular injection of current pulses in two different +/+ RTN neurons in the absence (control) or presence of ZD7288 (20 μm in patch-clamp recording pipette). All the traces in A and C were initiated with the same current protocol (shown below); initial holding potential (in millivolts) is indicated to the left of each trace. AP-5 (40 μm), CNQX (20 μm), and gabazine (10 μm) were present in the extracellular bath solution here and in C. B, Grouped data indicate that ZD7288 shifts the input–output curve to left in +/+ RTN neurons. *p < 0.05 versus control (n = 12 per each group; unpaired t test). C, The same experiment as depicted in A was performed in HCN2 −/− RTN neurons. ZD7288 did not increase spike firing. D, Grouped data demonstrate lack of effect of ZD7288 on HCN2 −/− RTN neurons (n = 13 per each group). Inset, Comparison of input–output curves between +/+ RTN neurons in the presence of ZD7288 and −/− RTN neurons under control conditions (no ZD7288).
Figure 10.
Figure 10.
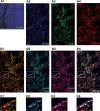
HCN2 colocalizes with GluR4 in dendritic spines of RTN neurons. A1, A high level of AMPA receptor subunit 4 (GluR4, blue) immunoreactivity is detected in the RTN. Scale bars: A1, 200 μm; A2–A4, B1–B4, 5 μm; C1–C4, 2 μm. A2–A4, A high-magnification confocal fluorescence micrograph shows strong punctate immunofluorescence corresponding to GluR4 (A2), cortactin (Cort; green, A3), and HCN2 (red, A4) in +/+ RTN neurons. B1, Overlay of images in A3 and A4. Yellow represents regions of apparent colocalization of cortactin with HCN2 immunofluorescent signals. B2, Overlay image shows that GluR4-immunoreactive puncta in A2 colocalize with that for cortactin-IR in A3, suggesting that GluR4 subunits are expressed in dendritic spines of +/+ RTN neurons. The cyan signal indicates overlap of the GluR4 signal with that of cortactin. B3, GluR4-immunoreactive puncta in A2 also colocalize with HCN2-IR in A4. The overlap between HCN2 and GluR4 signal is shown in magenta. B4, GluR4- and HCN2-IRs overlap with that of cortactin (white), indicating that GluR4 colocalizes with HCN2 in dendritic spines. C1–C4, High-magnification view of B1–B4 boxed regions showing colocalization of HCN2- with cortactin-IR (C1) and GluR4-IR colocalization with either cortactin-IR (C2) or HCN2-IR (C3). A number of structures resembling dendritic spines (C4, white) show colocalization of GluR4-, HCN2-, and cortactin-IR.

Similar articles

Cited by

References

    1. Abbas SY, Ying SW, Goldstein PA. Compartmental distribution of hyperpolarization-activated cyclic-nucleotide-gated channel 2 and hyperpolarization-activated cyclic-nucleotide-gated channel 4 in thalamic reticular and thalamocortical relay neurons. Neuroscience. 2006;141:1811–1825. - PubMed
    1. Arcelli P, Frassoni C, Regondi MC, De Biasi S, Spreafico R. GABAergic neurons in mammalian thalamus: a marker of thalamic complexity? Brain Res Bull. 1997;42:27–37. - PubMed
    1. Avanzini G, de Curtis M, Panzica F, Spreafico R. Intrinsic properties of nucleus reticularis thalami neurones of the rat studied in vitro. J Physiol (Lond) 1989;416:111–122. - PMC - PubMed
    1. Bal T, McCormick DA. Mechanisms of oscillatory activity in guinea-pig nucleus reticularis thalami in vitro: a mammalian pacemaker. J Physiol (Lond) 1993;468:669–691. - PMC - PubMed
    1. Berger T, Lüscher HR. Associative somatodendritic interaction in layer V pyramidal neurons is not affected by the antiepileptic drug lamotrigine. Eur J Neurosci. 2004;20:1688–1693. - PubMed

Publication types

MeSH terms

LinkOut - more resources