. 2007 Sep 3;97(5):646-53.
doi: 10.1038/sj.bjc.6603922. Epub 2007 Aug 7.

Cellular adaptations to hypoxia and acidosis during somatic evolution of breast cancer

Affiliations

Cellular adaptations to hypoxia and acidosis during somatic evolution of breast cancer

R A Gatenby et al. Br J Cancer. .

Abstract

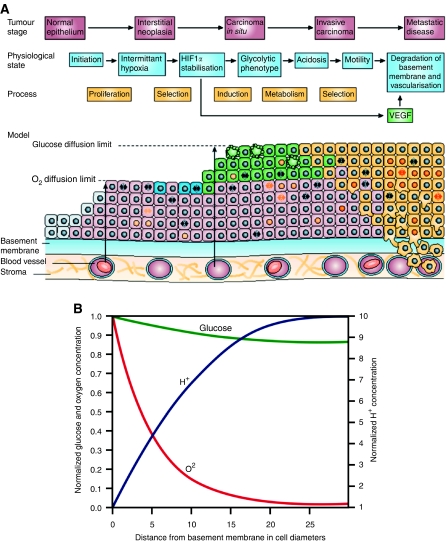
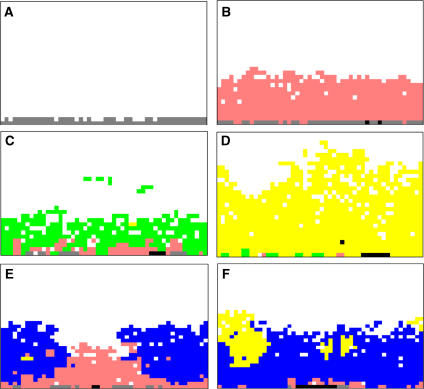
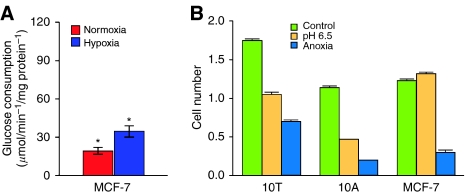
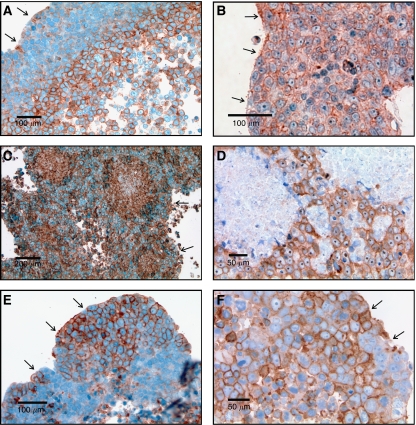
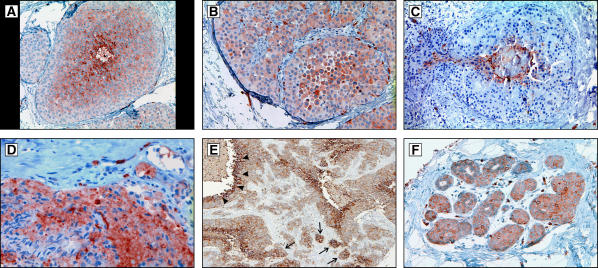
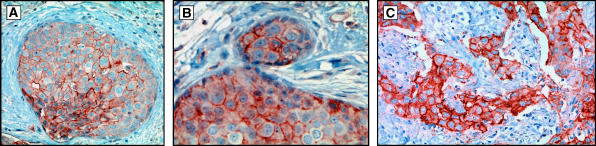
Conceptual models of carcinogenesis typically consist of an evolutionary sequence of heritable changes in genes controlling proliferation, apoptosis, and senescence. We propose that these steps are necessary but not sufficient to produce invasive breast cancer because intraductal tumour growth is also constrained by hypoxia and acidosis that develop as cells proliferate into the lumen and away from the underlying vessels. This requires evolution of glycolytic and acid-resistant phenotypes that, we hypothesise, is critical for emergence of invasive cancer. Mathematical models demonstrate severe hypoxia and acidosis in regions of intraductal tumours more than 100 microm from the basement membrane. Subsequent evolution of glycolytic and acid-resistant phenotypes leads to invasive proliferation. Multicellular spheroids recapitulating ductal carcinoma in situ (DCIS) microenvironmental conditions demonstrate upregulated glucose transporter 1 (GLUT1) as adaptation to hypoxia followed by growth into normoxic regions in qualitative agreement with model predictions. Clinical specimens of DCIS exhibit periluminal distribution of GLUT-1 and Na(+)/H(+) exchanger (NHE) indicating transcriptional activation by hypoxia and clusters of the same phenotype in the peripheral, presumably normoxic regions similar to the pattern predicted by the models and observed in spheroids. Upregulated GLUT-1 and NHE-1 were observed in microinvasive foci and adjacent intraductal cells. Adaptation to hypoxia and acidosis may represent key events in transition from in situ to invasive cancer.


Figures

Figure 1
Figure 1
(A) (from Gatenby and Gillies (2004) with permission). The evolution of breast cancer over time is shown left to right. Initial heritable changes in oncogenes, tumour suppressor genes, and senescent pathways result in unconstrained proliferation into the lumen and away from the basement membrane. However, since the cells remain separated from their blood supply by the intact basement membrane, proliferation is eventually limited by hypoxia. This promotes a switch to glycolytic metabolism that eventually becomes fixed due to normoxic–hypoxic cycles. The glycolysis leads to increased extracellular acid concentrations that produces toxicity through apoptosis and necrosis. This promotes evolution of a phenotype resistant to acid-induced toxicity. This population rapidly expands because it creates an environment that (1) is toxic to other populations that remain vulnerable to acid-induced toxicity and (2) promotes invasion. We hypothesise that this allows the population to breech the basement membrane and form an invasive cancer. Note that the original model assumed central tumour necrosis was caused by a decrease in glucose concentration. The model simulation's lower panel, however, demonstrates that this component of the hypothesis is incorrect since small declines in glucose concentrations are observed. Instead, it appears that central necrosis is due to a combination of hypoxia and acidosis. (B) Oxygen, glucose, and H+ concentrations in DCIS based on diffusion reaction mathematical models; y-axis is normalised concentrations and x-axis is distance from the basement membrane in cell diameters (assuming a typical diameter of 25 μm). Oxygen concentrations (red line) decline steeply with distance from the basement membrane resulting in severe hypoxia in regions only 5–10 cell layers from the membrane. Despite upregulation of glycolysis, glucose concentrations (green line) decline only modestly with distance. A steep increase in H+ concentrations is observed (blue line). This predicts hypoxia and acidosis will be commonly observed in ductal tumours greater than about 250 μm in diameter. However, proliferation should not be limited by glucose concentrations.
Figure 2
Figure 2
Simulations from the mathematical model described in the text showing potential evolutionary pathways in carcinoma in situ. Simulations start with a single layer of normal epithelial cells (grey cells) on a basement membrane (A). All simulations found that initial growth occurred only when mutations produced a hyperproliferative phenotype (pink cells) (B) through mutations in oncogenes, tumour suppressor genes, etc. Growth into the lumen eventually ceased, however, due to hypoxia and acidosis (Figure 1B). Without additional cellular evolution, this population remains limited. Additional growth occurred following two possible sequences: (1) heritable changes that upregulate glycolysis. This population with constitutive upregulation (green cells) (C) allow this new population to replace the hyperplastic cells and to extend further into the lumen. However, clonal expansion is eventually limited by acid-mediated toxicity. This promotes evolution of a glycolytic, acid-resistant phenotype (yellow cells) which rapidly replaces all other extant populations in a highly aggressive, infiltrative pattern extending to the basement membrane and farther into the lumen (D). (2) A second pathway begins with development of an acid-resistant population (blue cells). This population expands and replaces many of the hyperplastic population (E) but growth remains limited by hypoxia promoting emergence of a phenotype with upregulated glycolysis and acid resistance (yellow cells) identical to the population in (C). However, unlike in (C), this phenotype initially grows into the normoxic region forming nodules of varying size (F). These eventually coalesce into a pattern essentially identical to the appearance in (D).
Figure 3
Figure 3
(A) Cultured MCF-7 cells exhibit a low level of glucose metabolism under normoxic conditions. Under hypoxic condition, MCF-7 cells increase expression of HIF-1α resulting in upregulation of glycolysis and increased glucose consumption. This indicates this population exhibits a normal Pasteur effect and does not, at least initially, exhibit aerobic glycolysis (Warburg effect). (B) Survival of MCF-7 cells compared to 10A and 10T cells (using MTT assay) after 6 days under normal, anoxic, or acidic (DMEM with 10% FBS in humidified room air with 5% CO2 or nitrogen at pH 7.4 or 6.5) culture conditions. Note that all of the cell lines were adversely affected by anoxia, but the MCF-7 cells continued to proliferate under extremely acidic conditions (P<0.01).
Figure 4
Figure 4
Multiple immunohistochemistry images from spheroid at 1, 15, and 30 days following formation. The arrows mark the outer (oxygenated) edge of the spheroid. (A) Demonstrates GLUT-1 antibody distribution at day 1 with upregulation confined to the central regions of the spheroids presumably in response to hypoxia. (B) Shows NHE-1 staining at day 1 with uniform expression in both peripheral and central regions. This is consistent with constitutive upregulation as predicted by MCF-7 resistance to acidosis (Figure 3B). Uniform distribution of NHE-1 remained on day 15 and 30 spheroids. (C) Demonstrates GLUT1 expression in a spheroid at day 15 showing multiple nodules of cells with increased GLUT 1 throughout the rim similar to the nodular morphology predicted by the mathematical simulation in Figure 2F demonstrates. Note the nodule on the right contains central necrosis. (D) Shows NHE-1 distribution in the same spheroid in (C). Note that NHE-1 expression remains uniform throughout the specimen even adjacent to the areas of necrosis consistent with constitutive upregulation of NHE-1 expression. (E) Demonstrates GLUT1 distribution in a spheroid on day 30 which shows a cluster of cells expressing with increased expression of GLUT 1 in the peripheral, normoxic region of the spheroid. (F) A high magnification from the spheroid in (E) showing upregulation of GLUT-1 is primarily in the membrane but with increased cytoplasmic expression in some cells.
Figure 5
Figure 5
Examples of GLUT-1 distribution in DCIS and invasive breast cancer. (A) Shows central distribution of upregulated GLUT-1 with a gradient of intensity that parallels the transition from normoxia to hypoxia as predicted in Figure 1B and similar to the gradient observed in spheroids at day 1 (Figure 4A). (B) Demonstrates a nodule of cells that predominantly demonstrate upregulation of GLUT-1 in the periphery of DCIS similar to the nodules seen in spheroids (Figure 4C and D). (C) Demonstrates extension of cells with upregulated GLUT-1 from the periluminal regions directly into a focus of invasion. (D) Show populations of cells with increased GLUT-1 expression in the periphery of DCIS adjacent to foci of microinvasion in which the cells also have increased GLUT-1 expression. Note the diffuse intracellular staining (i.e. membrane, cytoplasmic, and nuclear). This pattern has been noted in a prior study (Brown et al, 2002). (E) Demonstrates a region of DCIS in the upper left increased GLUT-1 expression only in the luminal, hypoxic cells (arrowheads). In the lower right are foci of microinvasion with increased GLUT-1 expression (arrows). Note the cells with increased GLUT-1 expression adjacent to the basement membrane in the adjacent tumour filled duct. (F) Demonstrates GLUT-1-positive cells in an invasive cancer.
Figure 6
Figure 6
(A) Shows NHE-1 distribution in DCIS. In much of the lesion, NHE-1 expression is greatest in the central hypoxic region. Some cells with strongly increased NHE-1 expression, however, are extending into the normoxic region where there is a focal bulge into the basement membrane. In (B), there is a population of cells exhibiting increased NHE-1 expression in the periphery of DCIS adjacent to a focus of microinvasion which also exhibits increased expression of NHE-1. (C) Demonstrates upregulated NHE-1 in cells within an invasive breast cancer.

References

    1. Abbey CK, Borowsky AD, McGoldrick ET, Gregg JP, Maglione JE, Cardiff RD, Cherry SR (2005) In vivo PET imaging of progression of transformation in a mouse model of mammary neoplasia. Proc Natl Acad Sci USA 101: 11438–11443 - PMC - PubMed
    1. Anderson ARA (2005) A hybrid mathematical model of solid tumour invasion: the importance of cell adhesion. Math Med Biol 22: 163–186 - PubMed
    1. Bischof G, Cosentini E, Hamilton G, Riegler M, Zacherl J, Teleky B, Feil W, Schiessel R, Machen TE, Wenzl E (1996) Effects of extracellular pH on intracellular pH-regulation and growth in a human colon carcinoma cell-line. Biochim Biophys Acta 1282: 131–139 - PubMed
    1. Brown RS, Goodman TM, Zasadny KE, Greenson JK, Wahl RL (2002) Expression of hexokinase II and Glut-1 in untreated human breast cancer. Nuclear Med and Biol 29: 443–453 - PubMed
    1. Brown RS, Leung JY, Fisher SJ, Frey KA, Ethier SP, Wahl RL (1996) Intratumoral distribution of tritiated-FDG in breast carcinoma: correlation between Glut-1 expression and FDG uptake. J Nuc Med 37: 1042–1047 - PubMed

MeSH terms

Substances