

Ranking cancer risks of organic hazardous air pollutants in the United States
- PMID: 17687442
- PMCID: PMC1940102
- DOI: 10.1289/ehp.9884
Ranking cancer risks of organic hazardous air pollutants in the United States
Abstract
Background: In this study we compared cancer risks from organic hazardous air pollutants (HAPs) based on total personal exposure summed across different microenvironments and exposure pathways.
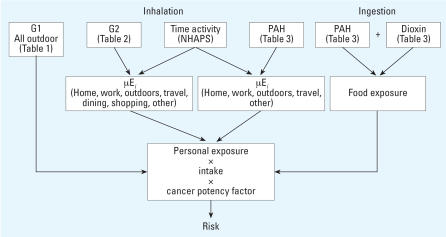
Methods: We developed distributions of personal exposure concentrations using field monitoring and modeling data for inhalation and, where relevant, ingestion pathways. We calculated risks for a nonoccupationally exposed and nonsmoking population using U.S. Environmental Protection Agency (EPA) and California Office of Environmental Health and Hazard Assessment (OEHHA) unit risks. We determined the contribution to risk from indoor versus outdoor sources using indoor/outdoor ratios for gaseous compounds and the infiltration factor for particle-bound compounds.
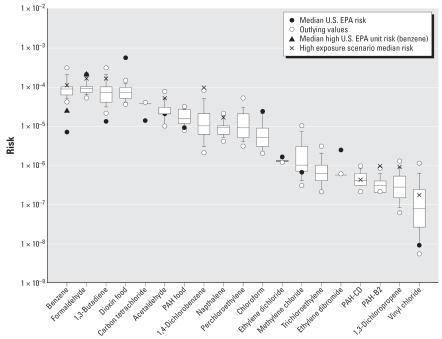
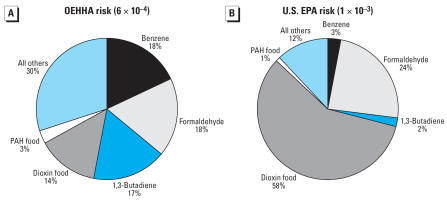
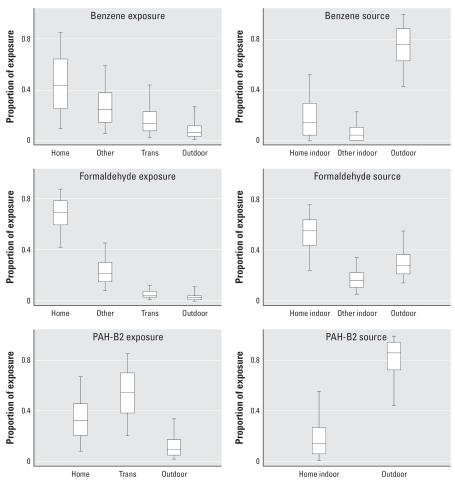
Results: With OEHHA's unit risks, the highest ranking compounds based on the population median are 1,3-butadiene, formaldehyde, benzene, and dioxin, with risks on the order of 10(-4)-10(-5). The highest risk compounds with the U.S. EPA unit risks were dioxin, benzene, formaldehyde, and chloroform, with risks on a similar order of magnitude. Although indoor exposures are responsible for nearly 70% of risk using OEHHA's unit risks, when infiltration is accounted for, inhalation of outdoor sources contributed 50% to total risk, on average. Additionally, 15% of risk resulted from exposures through food, mainly due to dioxin.
Conclusions: Most of the polycyclic aromatic hydrocarbon, benzene, acetaldehyde, and 1,3-butadiene risk came from outdoor sources, whereas indoor sources were primarily responsible for chloroform, formaldehyde, and naphthalene risks. The infiltration of outdoor pollution into buildings, emissions from indoor sources, and uptake through food are all important to consider in reducing overall personal risk to HAPs.
Figures
References
-
- Batterman SA, Peng C-Y, Braun J. Levels and composition of volatile organic compounds on commuting routes in Detroit, Michigan. Atmos Environ. 2002;36:6015–6030. doi: 10.1016/S1352-2310(02)00770-7. - DOI
-
- Butler JP, Post GB, Lioy PJ, Waldman JM, Greenberg A. Assessment of carcinogenic risk from personal exposure to benzo(a)pyrene in the Total Human Environmental Exposure Study (THEES) J Air Waste Manag Assoc. 1993;43(7):970–977. - PubMed
-
- California Environmental Protection Agency. Technical Support Document for Describing Available Cancer Potency Factors. 2005. [[accessed 5 December 2005]]. Available: http://www.oehha.ca.gov/air/hot_spots/pdf/May2005Hotspots.pdf.
Publication types
MeSH terms
Substances
LinkOut - more resources
Full Text Sources
Medical
Research Materials
