Comparative Study
. 2007 Aug 9:7:53.
doi: 10.1186/1472-6807-7-53.

Structural footprinting in protein structure comparison: the impact of structural fragments

Affiliations
Comparative Study

Structural footprinting in protein structure comparison: the impact of structural fragments

Elena Zotenko et al. BMC Struct Biol. .

Abstract

Background: One approach for speeding-up protein structure comparison is the projection approach, where a protein structure is mapped to a high-dimensional vector and structural similarity is approximated by distance between the corresponding vectors. Structural footprinting methods are projection methods that employ the same general technique to produce the mapping: first select a representative set of structural fragments as models and then map a protein structure to a vector in which each dimension corresponds to a particular model and "counts" the number of times the model appears in the structure. The main difference between any two structural footprinting methods is in the set of models they use; in fact a large number of methods can be generated by varying the type of structural fragments used and the amount of detail in their representation. How do these choices affect the ability of the method to detect various types of structural similarity?

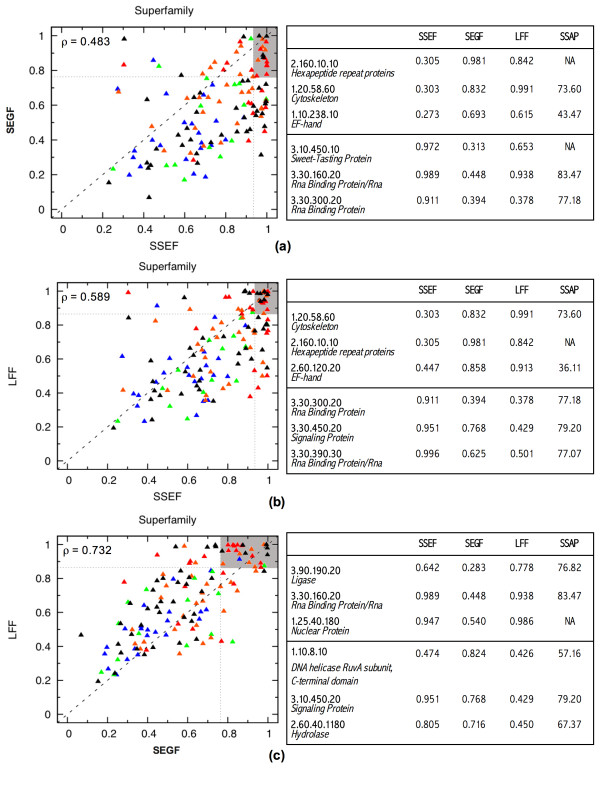
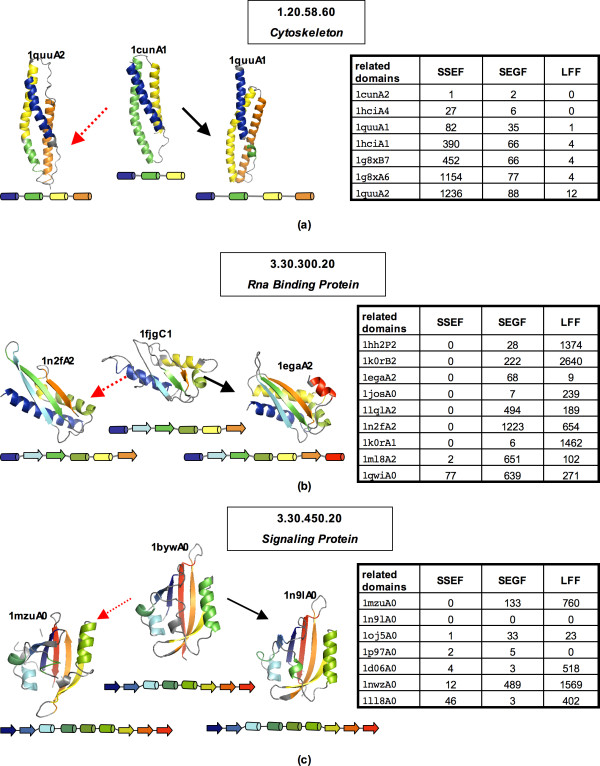
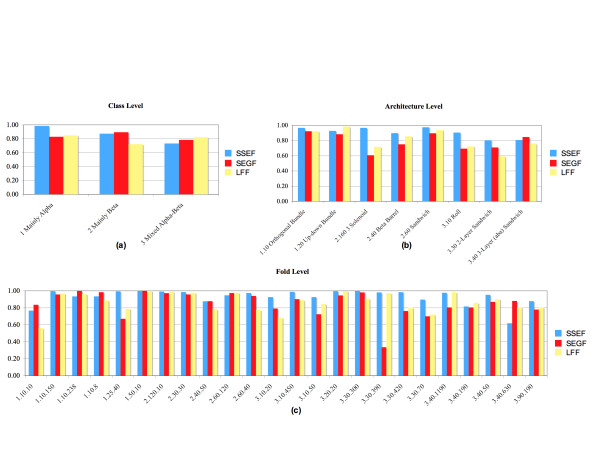
Results: To answer this question we benchmarked three structural footprinting methods that vary significantly in their selection of models against the CATH database. In the first set of experiments we compared the methods' ability to detect structural similarity characteristic of evolutionarily related structures, i.e., structures within the same CATH superfamily. In the second set of experiments we tested the methods' agreement with the boundaries imposed by classification groups at the Class, Architecture, and Fold levels of the CATH hierarchy.

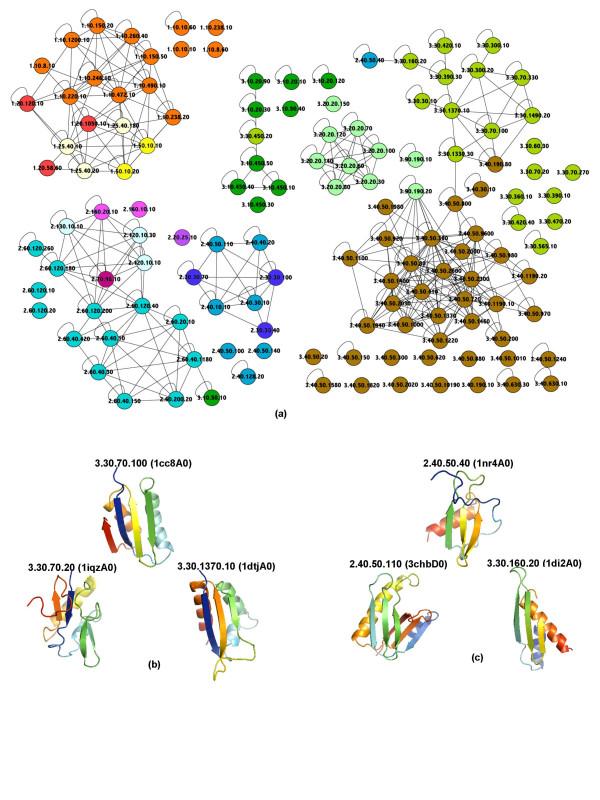
Conclusion: In both experiments we found that the method which uses secondary structure information has the best performance on average, but no one method performs consistently the best across all groups at a given classification level. We also found that combining the methods' outputs significantly improves the performance. Moreover, our new techniques to measure and visualize the methods' agreement with the CATH hierarchy, including the threshholded affinity graph, are useful beyond this work. In particular, they can be used to expose a similar composition of different classification groups in terms of structural fragments used by the method and thus provide an alternative demonstration of the continuous nature of the protein structure universe.


Figures

Figure 1
Figure 1
The relative performance of the methods, comparing the ROC300 score across superfamilies. There is one scatter plot per pair of methods: SSEF and SEGF (a), SSEF and LFF (b), and SEGF and LFF (c). Each superfamily is a point on the plot with the coordinates being the ROC300 scores of the corresponding methods. For a pair of methods, groups whose position significantly deviates from the main diagonal are examples of relative strength and weakness of the methods; for every pair of methods, six superfamilies that deviate the most from the diagonal are listed in the table adjacent to the plot. The superfamilies are colored according to the minimum SSAP score for a pair of domains in the superfamily as reported by the DHS database [23]: blue for scores in (0.0, 53.44], green for scores in (53.44, 63.32], orange for scores in (63.32, 73.48], and red for scores in (73.48, 100.00]. The SSAP (Sequential Structure Alignment Program) method [24] is a robust protein structure alignment method that uses a double dynamic programming strategy to align protein structures. The SSAP score measures the structural similarity on a scale from 100.0 (the most similar) to 0.0 (the least similar). Our chosen threshold values, 53.44, 63.32, and 73.48, correspond to the 25th, 50th, and 75th percentile respectively. The superfamilies for which the SSAP scores are not available are colored black. The correlation between the performance of every pair of methods is captured by Pearson correlation coefficient which is shown in upper left corner of the corresponding plots.
Figure 2
Figure 2
Outliers, the 1.20.58.60, 3.30.300.20, and 3.30.450.20 superfamilies. (a) The 1.20.58.60 (Cytoskeleton) superfamily; In the table to the right, for each database domain related to the query 1cunA1, we show the number of errors encountered before the domain is retrieved. Both the SEGF and LFF methods retrieve all seven related domains before the 300th error. (In this case, any domain in a fold group other than 1.20.58 is counted as an error.) In contrast, the SSEF method retrieves only 1cunA2, 1hciA4, and 1quuA1. The structure of the query domain 1cunA1 and two related domains are shown on the left, colored according to secondary structure assignments and also schematically represented by diagrams adjacent to the structures. The secondary structure assignment was computed using the DSSP (Dictionary of Protein Secondary Structure) program [25]. (b) The 3.30.300.20 (Rna Binding Protein) superfamily; Given the 1fjgC1 Domain as a query, the SSEF method retrieves all nine related domains before the 300th error. On the other hand, the SEGF and LFF method retrieve only five related domains. The ranking of the related domains is summarized in the table to the right. The structure of the query domain 1fjgC1 and two related domains are shown on the left, colored according to secondary structure assignments and also schematically represented by diagrams adjacent to the structures. (c) The 3.30.450.20 (Signaling Protein) superfamily, an example where the LFF method performs worse than the other two methods; Given the 1bywA0 domain as a query, the SSEF method retrieves all seven related domains, while the SEGF method retrieves six related domains before the 300th error. On the other hand, the LFF method retrieves only three related domains. The ranking of the related domains is summarized in the table to the right. The structure of the query domain 1bywA0 and two related domains are shown on the left, colored according to secondary structure assignments and also schematically represented by diagrams adjacent to the structures. The protein structures were rendered using PyMOL [26].
Figure 3
Figure 3
The thresholded affinity graph for the SSEF method. (a) The thresholded affinity graph for the SSEF method, where vertices are superfamilies in our dataset of 133 well populated CATH superfamilies and there is an edge between a pair of superfamilies if and only if both affinity scores are above a certain threshold. The threshold is such that 75% of self affinity scores, the affinity score of a superfamily to itself, are above this value. The superfamilies are color-coded according to the architecture group to which they belong. (Affinity graphs for the SEGF and LFF methods are given in the supplementary material [see Additional file 2].) (b)–(c) Structures of representative domains for some superfamilies involved in interesting interconnection patterns in the affinity graph. The affinity graph was drawn using Cytoscape [27]. The protein structures were rendered using PyMOL [26].
Figure 4
Figure 4
The agreement between the methods and the CATH hierarchy. Bar plots showing the degree of agreement between the methods' definition of structural similarity and the CATH hierarchy.
Figure 5
Figure 5
Determining the value of an overcrossing. When projection of a pair of oriented line segments results in an overcrossing, its value is determined by the right-hand rule involving the projection direction and directions of projected line segments. Here the projection direction is from the page to the reader. (a) The value of this overcrossing is +1 because the bottom line segment (u) is in the counterclockwise direction from the upper line segment (v). (b) The value of this overcrossing is -1 because the bottom line segment (u) is in the clockwise direction from the upper line segment (v).
Figure 6
Figure 6
Computing the average crossing number. (a) Projection directions that result in one overcrossing are parallel to vectors of the form tv - tu, where tu is on u and tv on v. (b) Those directions trace a parallelogram P = P1P2P3P4, where P1 = vsp - usp, P2 = vep - usp, P3 = vsp - uep and P4 = vep - uep. The average crossing number equals the signed area of P projected on S2 and normalized by half of the area of S2, which can be computed using tools of Spherical Geometry [28].

Similar articles

Cited by

References

    1. Zotenko E, O'Leary D, Przytycka T. Secondary structure spatial conformation footprint: a novel method for fast protein structure comparison and classification. BMC Struct Biol. 2006;6:12. doi: 10.1186/1472-6807-6-12. - DOI - PMC - PubMed
    1. Holm L, Sander C. Protein structure comparison by alignment of distance matrices. J Mol Biol. 1993;233:123–138. doi: 10.1006/jmbi.1993.1489. - DOI - PubMed
    1. Rogen P, Fain B. Automatic classification of protein structure by using Gauss integrals. Proc Natl Acad Sci USA. 2003;100:119–124. doi: 10.1073/pnas.2636460100. - DOI - PMC - PubMed
    1. Bostick D, Shen M, Vaisman I. A simple topological representation of protein structure: implications for new, fast, and robust structural classification. Proteins. 2004;56:487–501. doi: 10.1002/prot.20146. - DOI - PubMed
    1. Choi I, Kwon J, Kim S. Local feature frequency profile: a method to measure structural similarity in proteins. Proc Natl Acad Sci USA. 2004;101:3797–3802. doi: 10.1073/pnas.0308656100. - DOI - PMC - PubMed

Publication types

MeSH terms

LinkOut - more resources