. 2008 Mar;67(3):212-21.
doi: 10.1016/j.ijpsycho.2007.05.016. Epub 2007 Jul 12.

Joint independent component analysis for simultaneous EEG-fMRI: principle and simulation

Affiliations

Joint independent component analysis for simultaneous EEG-fMRI: principle and simulation

Matthias Moosmann et al. Int J Psychophysiol. 2008 Mar.

Erratum in

  • Int J Psychophysiol. 2008 Apr;68(1):81

Abstract

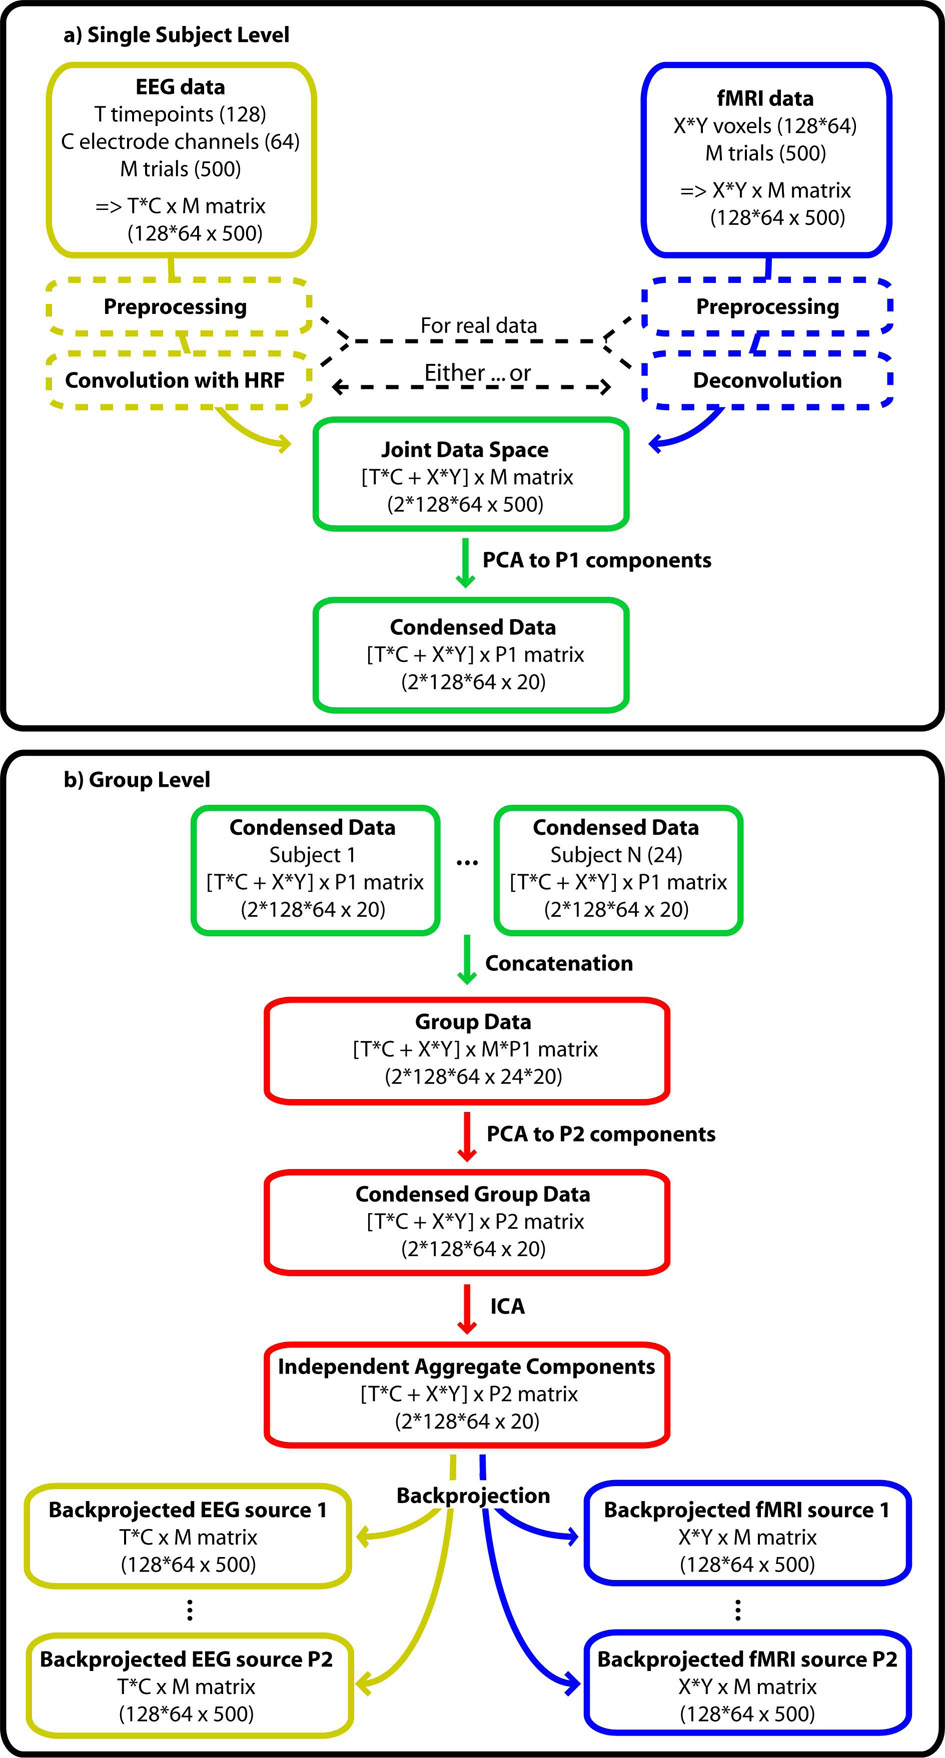
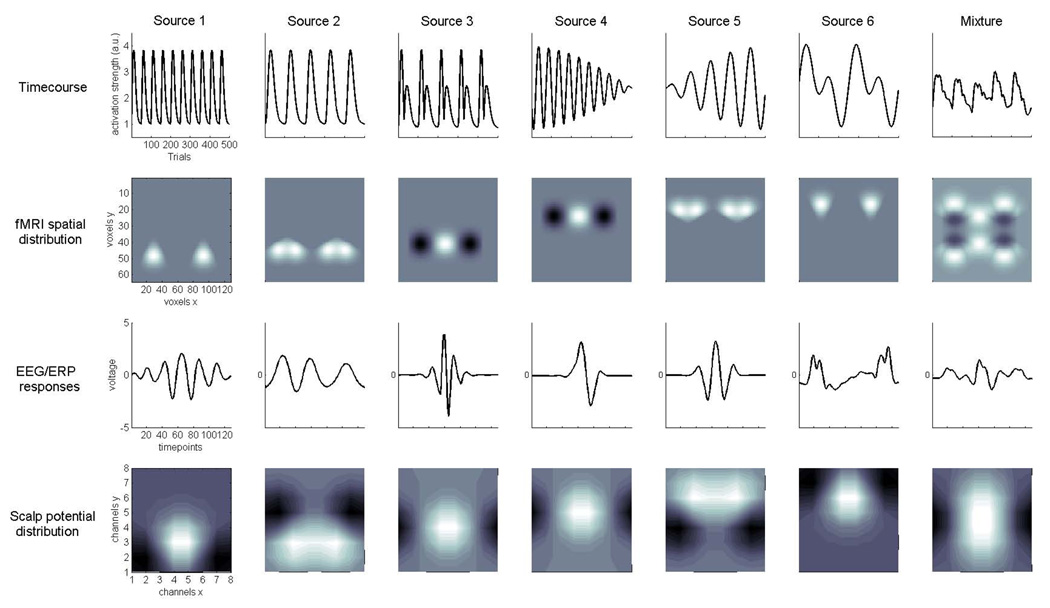
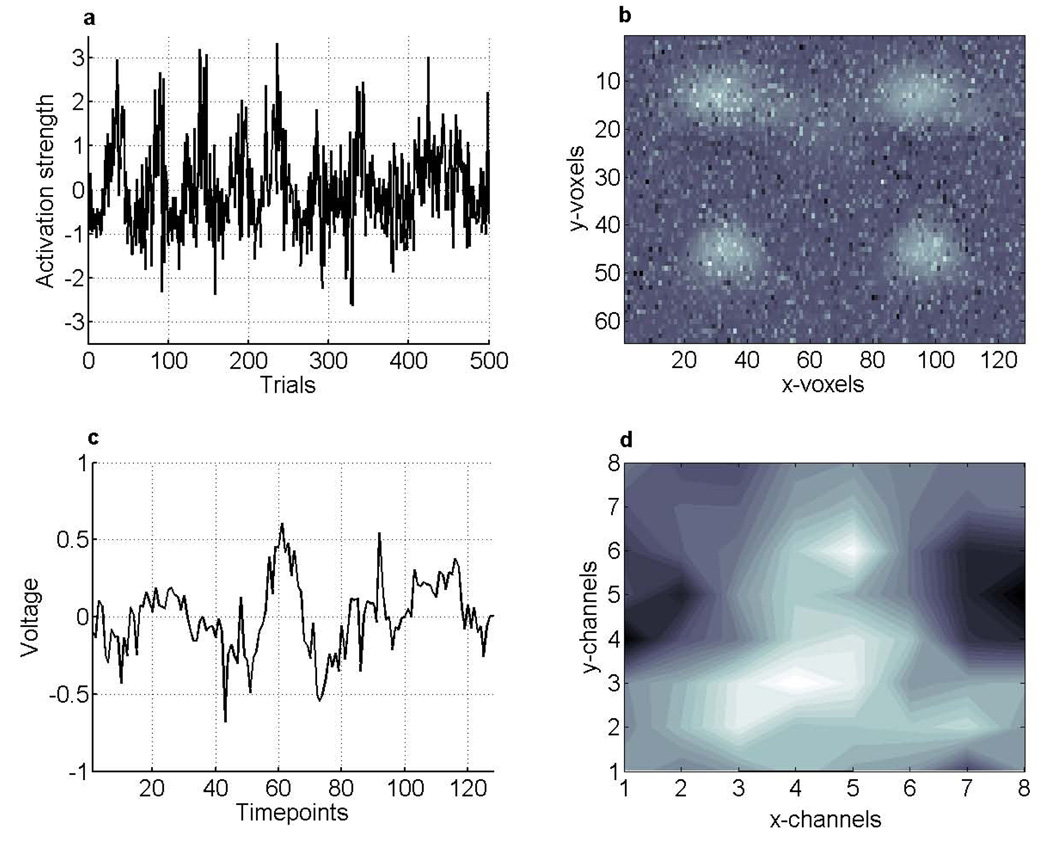
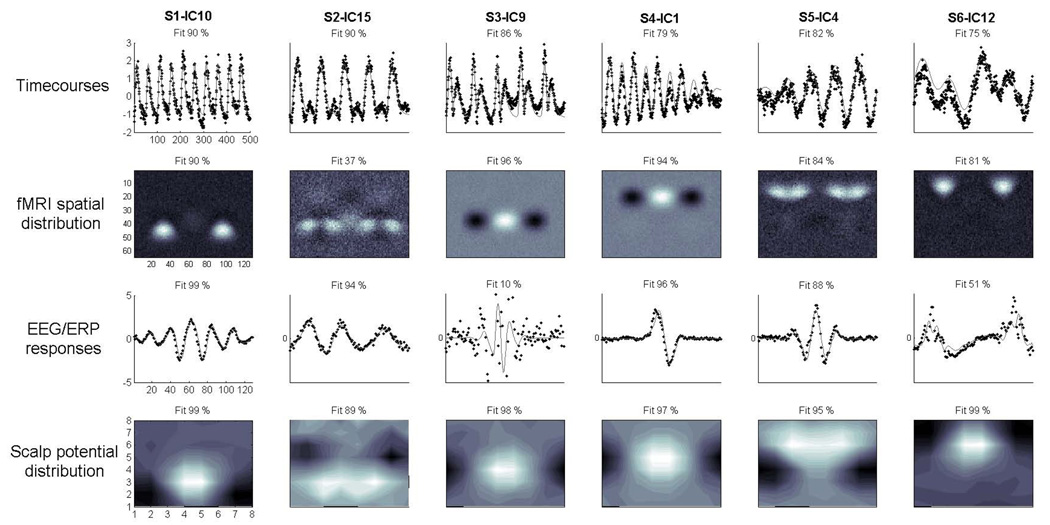
An optimized scheme for the fusion of electroencephalography and event related potentials with functional magnetic resonance imaging (BOLD-fMRI) data should simultaneously assess all available electrophysiologic and hemodynamic information in a common data space. In doing so, it should be possible to identify features of latent neural sources whose trial-to-trial dynamics are jointly reflected in both modalities. We present a joint independent component analysis (jICA) model for analysis of simultaneous single trial EEG-fMRI measurements from multiple subjects. We outline the general idea underlying the jICA approach and present results from simulated data under realistic noise conditions. Our results indicate that this approach is a feasible and physiologically plausible data-driven way to achieve spatiotemporal mapping of event related responses in the human brain.


Figures

Figure 1
Figure 1
Schematic illustration of the joint ICA approach. EEG and fMRI data should undergo typical preprocessing, including convolution or deconvolution to compensate for the hemodynamic lag before entering the joint data space. A PCA compresses the data on single subject level. Single subject data are then concatenated in an aggregate set. A second PCA condenses redundant information on group level before the data are decomposed into independent components. Backprojection to EEG and fMRI data space allows the visualization of the separated processes. The numbers in brackets specify the matrix dimension chosen in this simulation. The symbol ‘x’ denotes ‘by’ as in a 10 by 20 matrix whereas the symbol ‘*’ denotes multiplication.
Figure 2
Figure 2
Joint source model for ERP-fMRI data. The figure shows example of the simulated sources of neuronal activity detected in simultaneous single trial fMRI and EEG/ERP recordings. Columns from left to right contain the Sources 1–6 and their linear mixture: rows contain the key features, i.e. experimental timecourses, fMRI spatial distribution and ERP transient responses and scalp potential distribution. Axes are the same for all columns and are shown on the leftmost plots. For the six 500-point timecourses (1st row), trains gamma functions of different widths (S1, S2), and combinations of sine waves at different frequencies (S4, S5, S6) were used. fMRI spatial distributions (2nd row) of hemodynamic responses were simulated as partially overlapping gaussian-smooth regional increases (lighter shading) or decreases (darker shading) of activation in a 128×64 matrix. 128-point ERP transient responses (3rd row) were taken from filtered real-data averages and selected such that they covered a range of ERP shapes, and more continuous event related oscillations. Symmetric dipolar potential distribution maps (4th row) were additionally generated for an 8×8 grid of channels on the scalp.
Figure 3
Figure 3
Simulated data. A 500 trial experimental timecourse from an arbitrary volume element is shown in plot a. Plots b–d depict data from data-set #1 at trial #250, that is, the 128 × 64 voxel fMRI image. Light areas indicate areas of higher activation, and dark areas correspond to lesser activation. Plot c shows the 128 samples ERP voltage timecourse. Plot d shows the 8 × 8 channels 2D scalp potential map for timepoint #64. Lighter areas indicate positive voltage and darker areas negativity, reflecting the dipolar structure of these maps. Multiplication of c with d yields the 128 timepoints × 64 channels spatiotemporal ERP image.
Figure 4
Figure 4
Results. The figure displays the averaged estimated independent components with the overall best fit with the respective sources across the four features. Black dotted lines in the timecourse and EEG/ERP response plots indicate IC activation. Original sources were superimposed in grey for comparison in the first and third row. Percentage of variance accounted for is indicated above each plot.

References

    1. Allen PJ, Josephs O, Turner R. A method for removing imaging artifact from continuous EEG recorded during functional MRI. Neuroimage. 2000;12(2):230–239. - PubMed
    1. Bandettini PA, Wong EC, Hinks RS, Tikofsky RS, Hyde JS. Time course EPI of human brain function during task activation. Magn Reson Med. 1992;25(2):390–397. - PubMed
    1. Bell AJ, Sejnowski TJ. An information-maximization approach to blind separation and blind deconvolution. Neural Comput. 1995;7(6):1129–1159. - PubMed
    1. Bell AJ, Sejnowski TJ. The "independent components" of natural scenes are edge filters. Vision Res. 1997;37(23):3327–3338. - PMC - PubMed
    1. Benar CG, Schon D, Grimault S, Nazarian B, Burle B, Roth M, Badier JM, Marquis P, Liegeois-Chauvel C, Anton JL. Single-trial analysis of oddball event-related potentials in simultaneous EEG-fMRI. Hum Brain Mapp. 2007 - PubMed

Publication types

MeSH terms