. 2007 Sep 15;465(2):347-58.
doi: 10.1016/j.abb.2007.06.033. Epub 2007 Jul 23.

Cloning and functional characterization of a novel mitochondrial N-ethylmaleimide-sensitive glycerol-3-phosphate acyltransferase (GPAT2)

Affiliations

Cloning and functional characterization of a novel mitochondrial N-ethylmaleimide-sensitive glycerol-3-phosphate acyltransferase (GPAT2)

Shuli Wang et al. Arch Biochem Biophys. .

Abstract

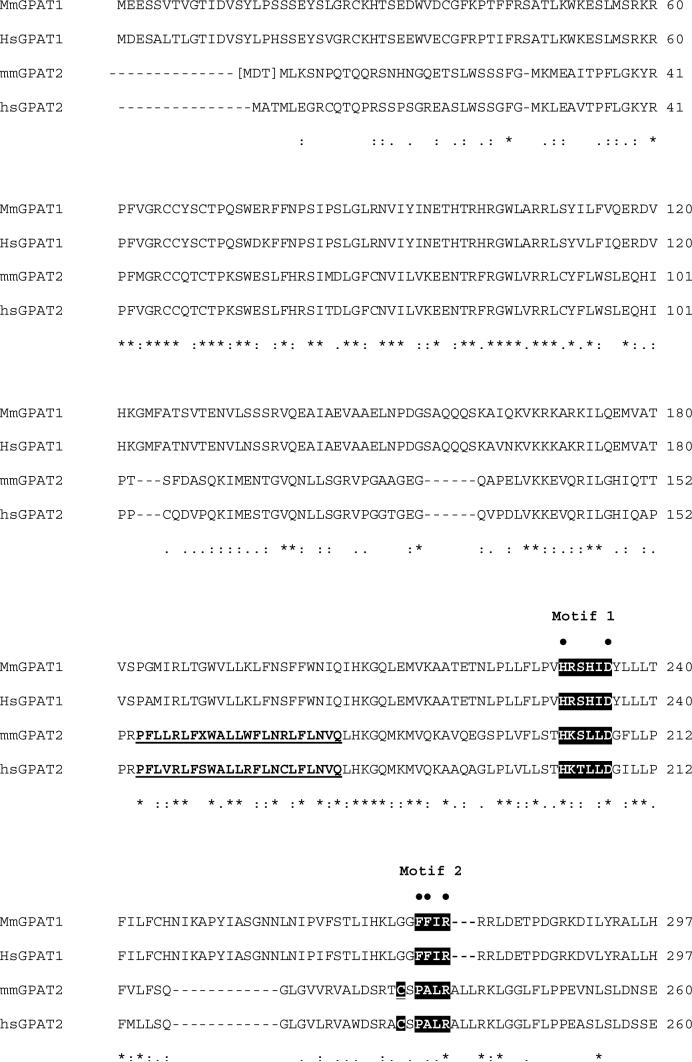
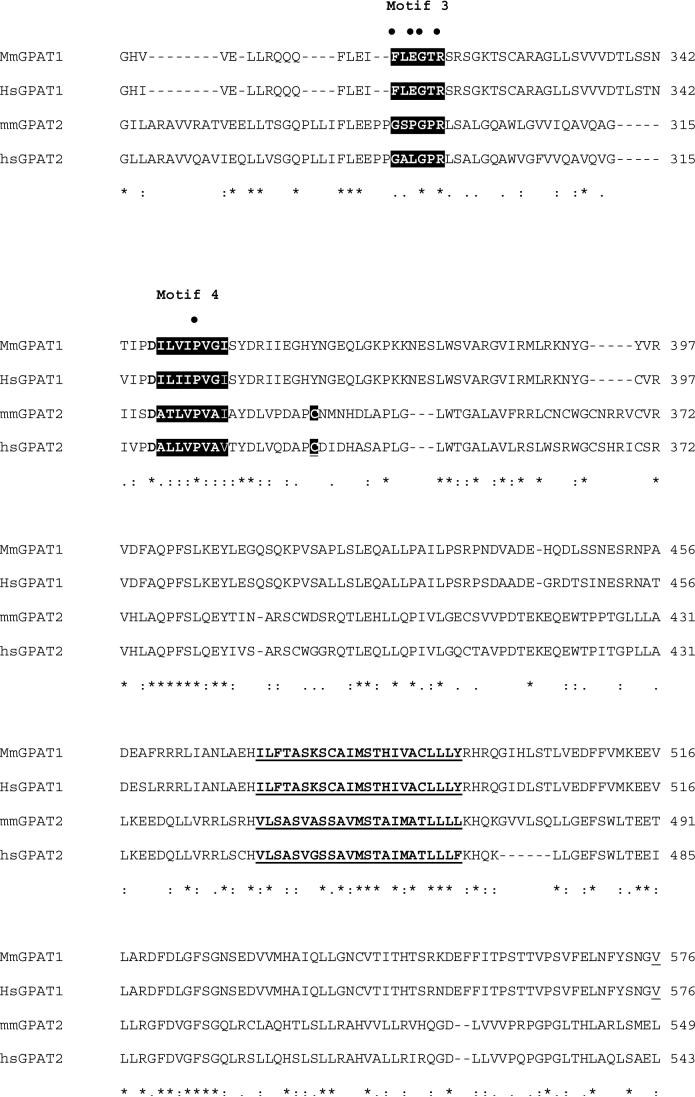
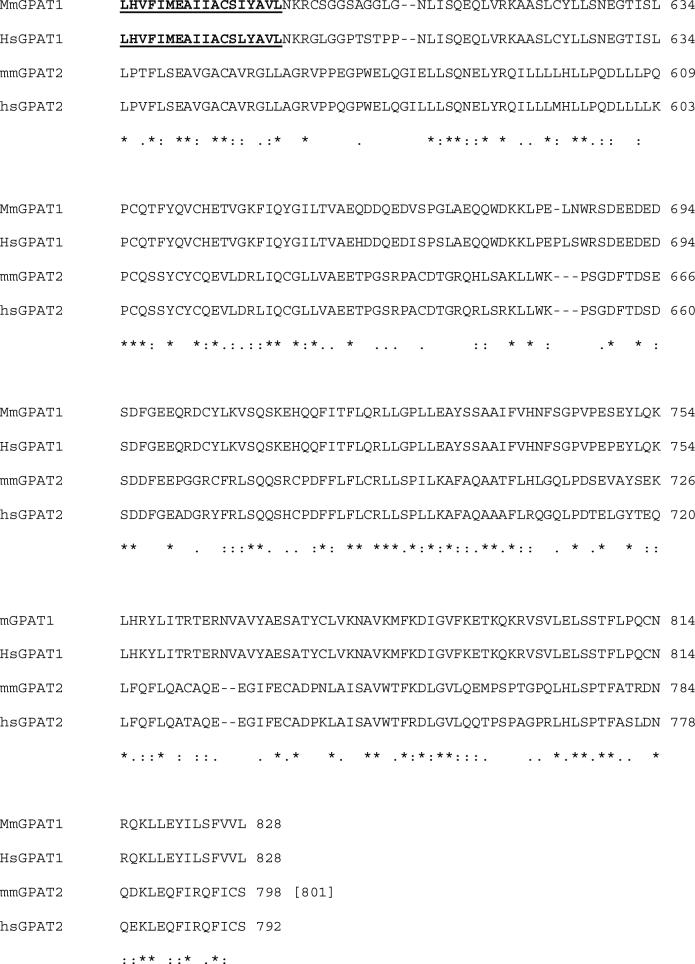
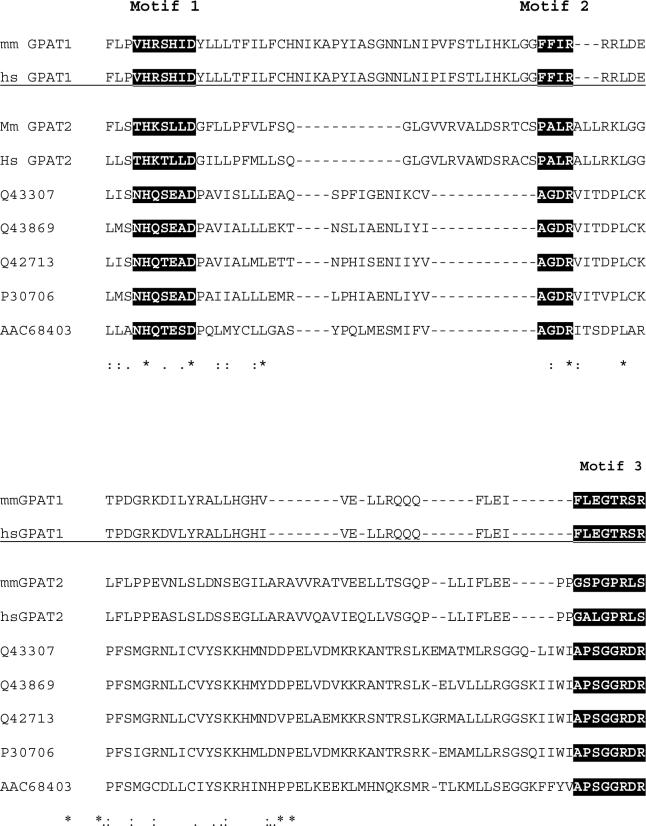
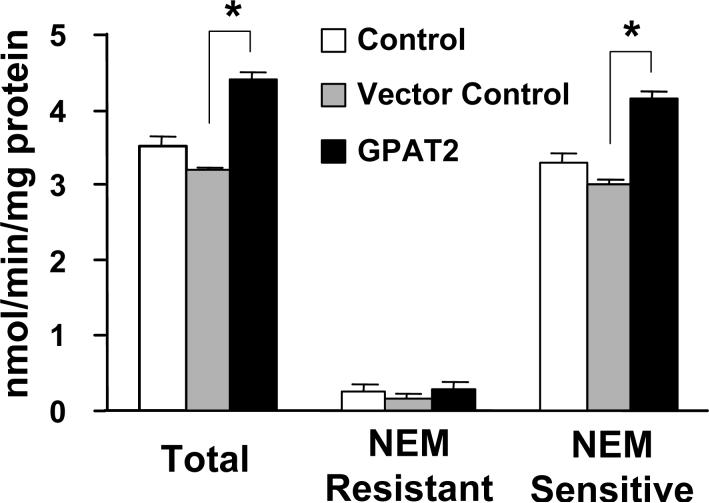
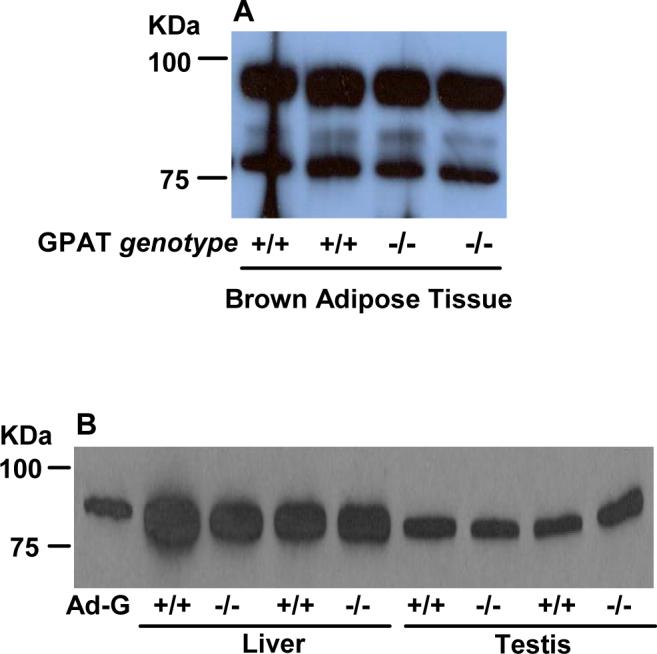
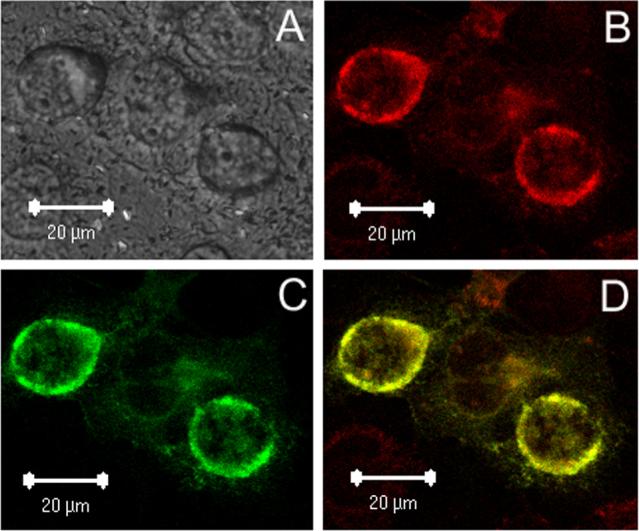
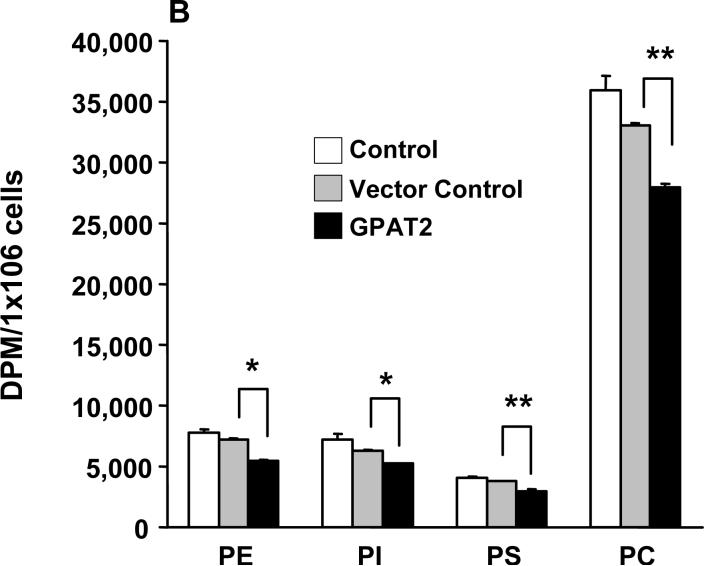
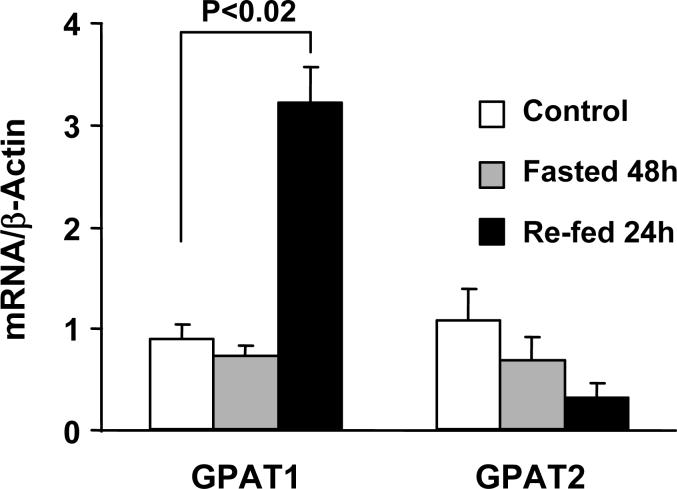
Glycerol-3-phosphate acyltransferase (GPAT) catalyzes the initial and rate-limiting step in glycerolipid synthesis. Several mammalian GPAT activities have been recognized, including N-ethylmaleimide (NEM)-sensitive isoforms in microsomes and mitochondria and an NEM-resistant form in mitochondrial outer membrane (GPAT1). We have now cloned a second mitochondrial isoform, GPAT2 from mouse testis. The open-reading frame encodes a protein of 798 amino acids with a calculated mass of 88.8kDa and 27% amino acid identity to GPAT1. Testis mRNA expression was 50-fold higher than in liver or brown adipose tissue, but the specific activity of NEM-sensitive GPAT in testis mitochondria was similar to that in liver. When Cos-7 cells were transiently transfected with GPAT2, NEM-sensitive GPAT activity increased 30%. Confocal microscopy confirmed a mitochondrial location. Incubation of GPAT2-transfected Cos-7 cells with trace (3 microM; 0.25 microCi) [1-(14)C]oleate for 6h increased incorporation of [(14)C]oleate into TAG 84%. In contrast, incorporation into phospholipid species was lower than in control cells. Although a polyclonal antibody raised against full-length GPAT1 detected an approximately 89-kDa band in liver and testis from GPAT1 null mice and both 89- and 80-kDa bands in BAT from the knockout animals, the GPAT2 protein expressed in Cos-7 cells was only 80 kDa. In vitro translation showed a single product of 89 kDa. Unlike GPAT1, GPAT2 mRNA abundance in liver was not altered by fasting or refeeding. GPAT2 is likely to have a specialized function in testis.


Figures

Fig. 1
Fig. 1. GPAT2 protein sequence analysis.
A.) Alignment of mouse (NP_001074558) and human (AAH68596; BAD18392) GPAT2 and of mouse ( NP_032175) and human (NP_065969) GPAT1 amino acid sequences. Mouse GPAT2 is shown with the start site for the 801 amino acid protein in brackets. The conserved catalytic amino acid residues for GPAT (Motifs 1−4) are indicated by white lettering on black. Residues in motifs 1−4 that have been shown to be important for GPAT1 or E. coli plsB activity are indicated by a dot (•) above the residue [1]. Cysteines near active site motifs and present in GPAT2 only shown in white lettering on black and underlined. The transmembrane domains for GPAT1 [19] and the potential transmembrane domains for GPAT2 are bolded and underlined. Amino acid residues identical for all isoforms are indicated with an asterisk (*); conservation of strong groups is indicated with two dots (:); conservation of weak groups is indicated with one dot (.) B) Comparison of the active site regions of GPAT2, plant chloroplast GPATs, and Chlamydia GPAT. Q43307, Arabidopsis Thaliana; Q43869, Spinacia oleracea; Q42713, Carthamus tinctorius (safflower); P30706, Pisum sativum (pea); AAC68403, Chlamydia trachomatis. Glycerolipid acyltransferase motifs and identical and conserved amino acid residues in GPAT2, plant chloroplast GPATs, and Chlamydia GPAT are shown as above. The mmGPAT1 and hsGPAT1 amino acids in this region are shown for comparison.
Fig. 2
Fig. 2. GPAT2 is highly expressed in testis.
Pieces of rat tissues stored in RNALater were homogenized with a rotor-stator homogenizer and RNA was isolated with the RNeasy kit. Samples were analyzed in triplicate on an ABI Prism 7700 Sequence Detection System and data were analyzed using the relative standard curve method. Expression was normalized to β-actin. BAT, brown adipose tissue; RET-Ad, retroperitoneal adipose; GON-Ad, gonadal adipose; ING-Ad, inguinal adipose; GAST, gastrocnemius, DM, duodenal mucosa.
Fig. 3
Fig. 3. Overexpression of GPAT2 increases NEM-sensitive GPAT activity.
Cos-7 cells were either not transfected (control), transfected with empty pcDNA3.1(+) (vector control), or transfected with pcDNA3.1(+)- GPAT2-Flag cDNA (GPAT2). Thirty-six h after transfection, cell homogenates were prepared and centrifuged at 100,000 x g to obtain total membranes. GPAT activity was assayed after incubation in the presence or absence of 2 mM NEM. Data are shown as means ± SE (n = 9); * p<0.05.
Fig. 4
Fig. 4. Translated GPAT1 and 2 have similar molecular masses, whereas masses of GPAT1 and 2 expressed in cells differ.
Cos-7 cells were transfected with plasmids containing empty vector (EV), GPAT1-Flag or GPAT2-Flag for 36 h. Transcription and translation was performed in vitro as described in Experimental Procedures. The GPAT cDNA templates including the T7 promoter were used for transcription and translation in 25 μl reactions containing 20 mM methionine, 1 μl biotin-Lys-tRNA and 1 μl pancreatic microsomal membranes The reaction mixture was incubated at 37°C for 1 h. Lanes contained 60 μg of Cos-7 cell total particulate protein or 1.2 μl of GPAT1 or GPAT2 reaction aliquots. Proteins were analyzed on the same 8% gel by polyacrylamide gel electrophoresis. Proteins expressed in Cos-7 cells were visualized with anti-FLAG M2 antibodies and in vitro translated proteins were detected with biotin/streptavidin-HRP.
Fig. 5
Fig. 5. Protein expression of GPAT1 and GPAT2.
A) 40 μg brown adipose tissue total particulate protein or B) 50 μg liver or testis total particulate protein from WT (+/+) or Gpat1−/− mice. Proteins were separated by 8% SDS-PAGE and transferred to a PVDF membrane. Primary rabbit anti-GPAT1 polyclonal antibody was used to recognize GPAT isoforms. Ad-G, GPAT1 expressed in COS-7 cells with an adenovirus vector
Fig. 6
Fig. 6. GPAT2 colocalizes with mitochondria.
Cos-7 cells were transiently transfected with pcDNA3.1-GPAT2-Flag for 36 h and stained as described under Experimental Procedures. A) DIC; B) Mito-Tracker; C) anti-FLAG primary antibody and AlexaFluor 488-conjugated secondary antibody; D) merged image of B and C. The figure is representative of two independent transfections.
Fig. 7
Fig. 7. GPAT2 overexpression increases incorporation of [14C]oleic acid into triacylglycerol and decreases incorporation into phospholipids.
Cos-7 cells at 75% confluence were either untransfected (Control) or transfected with pcDNA3.1 (Vector control) or with pcDNA3.1-GPAT2-Flag plasmid (GPAT2). At 14 h after transfection the labeling media was replaced with DMEM supplemented with 10% FBS, 0.5% BSA, 1 mM carnitine, and 0.25μCi of [14C]oleic acid/dish and incubated for 6 h. Lipids were extracted and separated as described under Experimental Procedures (n=3). A. Neutral and phospholipids; B. Phospholipid species. The graphs are representative of an experiment that was repeated 3 times. * p< 0.05; ** p < 0.01 compared to vector control cells.
Fig. 8
Fig. 8. Regulation of GPAT1 and GPAT2 mRNA expression in rat liver.
GPAT1 and mtGPAT 2 expression in liver from untreated rats and from rats that were fasted for 48 h or fasted for 48 h and then refed for 24 h with a 69% sucrose diet. (n = 4 for each treatment)

References

    1. Coleman RA, Lee DP. Enzymes of triacylglycerol synthesis and their regulation. Prog. Lipid Res. 2004;43:134–176. - PubMed
    1. Saggerson E, Carpenter C, Cheng C, Sooranna SR. Subcellular distribution and some properties of N-ethylmaleimide-sensitive and-insensitive forms of glycerol phosphate acyltransferase in rat adipocytes. Biochem. J. 1980;190:183–189. - PMC - PubMed
    1. Lewin TM, Schwerbrock NMJ, Lee DP, Coleman RA. Identification of a new glycerol-3-phosphate acyltransferase isoenzyme, mtGPAT2, in mitochondria. J. Biol. Chem. 2004;279:13488–13495. - PubMed
    1. Cao J, Li JL, Li D, Tobin JF, Gimeno RE. Molecular identification of microsomal acyl-CoA:glycerol-3-phosphate acyltransferase, a key enzyme in de novo triacylglycerol synthesis. Proc. Natl. Acad. Sci. USA. 2006;103:19695–19700. - PMC - PubMed
    1. Vancura A, Haldar D. Purification and characterization of glycerophosphate acyltransferase from rat liver mitochondria. J. Biol. Chem. 1994;269:27209–27215. - PubMed

Substances