. 2008 Jun 6;5(23):653-62.
doi: 10.1098/rsif.2007.1138.

Eliminating human tuberculosis in the twenty-first century

Affiliations

Eliminating human tuberculosis in the twenty-first century

Christopher Dye et al. J R Soc Interface. .

Abstract

Recognizing that tuberculosis (TB) is still the leading cause of human death from a curable infection, the international health community has set ambitious targets for disease control. One target is to eliminate TB by 2050; that is, to cut the annual incidence of new cases to less than 1 per million population. National TB control programmes are working to eliminate TB mainly by intensifying efforts to find and cure patients with active disease. Here, we use mathematical modelling to show that, while most TB patients can be cured with present drug regimens, the 2050 target is far more likely to be achieved with a combination of diagnostics, drugs and vaccines that can detect and treat both latent infection and active disease. We find that the coupling of control methods is particularly effective because treatments for latent infection and active disease act in synergy. This synergistic effect offers new perspectives on the cost-effectiveness of treating latent TB infection and the impact of possible new TB vaccines. Our results should be a stimulus to those who develop, manufacture and implement new technology for TB control, and to their financial donors.


Figures

Figure 1
Figure 1
TB epidemic trends in the world (black), sub-Saharan Africa (red) and world excluding sub-Saharan Africa (blue). Series are the estimated incidence rates per million population per year, based on country case reports (World Health Organization 2007). The TB incidence rate increased by an annual average of 6% in Africa between 1990 and 2005, but fell by 0.7% annually in the rest of the world.
Figure 2
Figure 2
Flow chart of the TB model. Red lines show the direction of effective transmission; all groups are exposed to infection, but there are significant aetiological, clinical or epidemiological consequences only for those people who are uninfected (U) or latently infected (Ls or Lf). Children and adults, for whom the natural history of TB is qualitatively similar but quantitatively different, are distinguished in the model but not in this diagram. Green lines show the possible transitions due to vaccination and drug treatment. Those who are successfully vaccinated are immunized for life. People are lost by death from all six groups, but only TB deaths are shown.
Figure 3
Figure 3
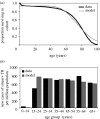
(a) Age-dependent survival in the human population, with the model fitted (grey curve) to the combined survival cures of India and China (black curve; Murray et al. 2002). These and other Asian countries account for an estimated 56% of all new TB cases arising each year. (b) Fit of the model (grey bars) to the incidence of sputum smear-positive TB cases by age (black bars), as estimated for 2005 (World Health Organization 2007).
Figure 4
Figure 4
(a) Trajectory of TB incidence in a control programme that treats active TB, beginning in 2007. The total incidence rate per million population per year (black line, left axis, logarithmic scale) pre-control was approximately the same as for the world excluding sub-Saharan Africa. The red and blue lines distinguish, respectively, cases arising from recent infection or reinfection (fast progression) and from the reactivation of latent infection (slow progression). The detection rate of active TB cases (δ=0.6) was assumed to be constant between 2007 and 2050, and case detection and cure rates initially reached the target values set by the WHO. In the early stages of the treatment programme, the incidence rate fell by up to 18% annually (green line, right axis), but the rate of decline slowed thereafter. (b) TB incidence per million population in 2050, as a function of the detection rate, δ.
Figure 5
Figure 5
Univariate sensitivity analysis of model parameters. The vertical axis shows the change in equilibrium incidence per million per year divided by 0.1% of the value of the relevant parameter, as described in §2. Black bars are increases in equilibrium incidence and white bars are decreases.
Figure 6
Figure 6
Pairwise combinations of three control methods to control TB, starting from an annual incidence of 1034 per million population. Surfaces show the expected incidence rates in 2050 with (a) pre-exposure vaccination and treatment of active TB, (b) treatment of latent infection and active TB, (c) treatment of latent infection and pre-exposure vaccination, and (d) as for (b), but with TB death rate as the outcome. Colours in (a)–(c) indicate ranges of incidence rates per million population reached by 2050: <1 (dark green, below elimination threshold), <10 (light green), <100 (orange) and ≥100 (red). Since there are fewer TB deaths than cases, the colour scale in (d) is shifted by a factor of 10.
Figure 7
Figure 7
Synergistic effect of treating both latent infection and active TB. The results in figure 4b are presented as the relative benefits, in terms of reduced incidence, attributable to the two interventions acting in synergy. The relative benefit is calculated from the incidence rates in 2050 (I250) obtained by: [I250 when treating active TB only]×[I250 when treating latent infection only]/[I250 when combining interventions].

References

    1. Andersen P, Doherty T.M. The success and failure of BCG—implications for a novel tuberculosis vaccine. Nat. Rev. Microbiol. 2005;3:656–662. doi: 10.1038/nrmicro1211. - DOI - PubMed
    1. Anderson R.M, May R.M. Oxford University Press; Oxford, UK: 1991. Infectious diseases of humans: dynamics and control.
    1. Andersen P, Doherty T.M, Pai M, Weldingh K. The prognosis of latent tuberculosis: can disease be predicted? Trends Mol. Med. 2007;13:175–182. doi: 10.1016/j.molmed.2007.03.004. - DOI - PubMed
    1. Aziz M.A, et al. Epidemiology of antituberculosis drug resistance (the global project on anti-tuberculosis drug resistance surveillance): an updated analysis. Lancet. 2006;368:2142–2154. doi: 10.1016/S0140-6736(06)69863-2. - DOI - PubMed
    1. Berkeley Madonna. Berkeley-Madonna: modeling and analysis of dynamic systems. University of California; Berkeley, CA: 2007.

Publication types

Substances