. 2007 Sep;130(Pt 9):2387-400.
doi: 10.1093/brain/awm173. Epub 2007 Aug 9.

Disrupted prediction-error signal in psychosis: evidence for an associative account of delusions

Affiliations

Disrupted prediction-error signal in psychosis: evidence for an associative account of delusions

P R Corlett et al. Brain. 2007 Sep.

Abstract

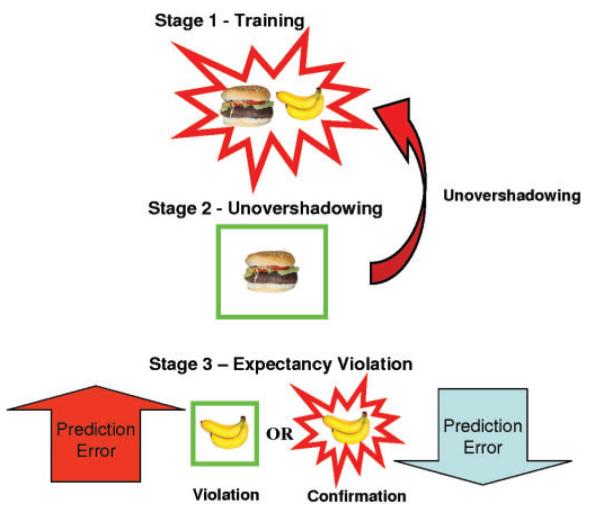
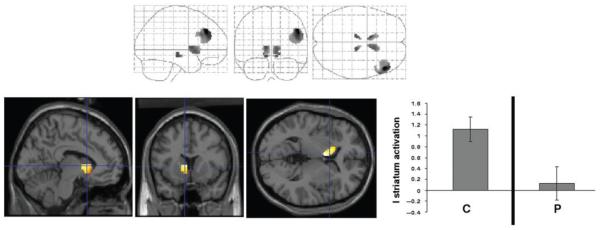
Delusions are maladaptive beliefs about the world. Based upon experimental evidence that prediction error-a mismatch between expectancy and outcome--drives belief formation, this study examined the possibility that delusions form because of disrupted prediction--error processing. We used fMRI to determine prediction-error-related brain responses in 12 healthy subjects and 12 individuals (7 males) with delusional beliefs. Frontal cortex responses in the patient group were suggestive of disrupted prediction-error processing. Furthermore, across subjects, the extent of disruption was significantly related to an individual's propensity to delusion formation. Our results support a neurobiological theory of delusion formation that implicates aberrant prediction-error signalling, disrupted attentional allocation and associative learning in the formation of delusional beliefs.


Figures

Fig. 1
Fig. 1. Trial structure.
On each trial, subjects were presented with a meal that their patient had eaten, and then they made a predictive response. Finally they were informed of the effect of that meal on their patient.
Fig. 2
Fig. 2. Experimental stages.
Stage 1—Training: This preliminary stage set up the expectancies. The key trial types in this were pairs of foods (in this case, hamburger paired with banana) in which subjects learned to expect an allergic response. Stage 2—Unovershadowing: In the unovershadowing condition, one cue from the pair (here, Hamburger) that had previously been paired with an allergy was presented without an allergy outcome. The aim was to engender an augmented expectancy that the other cue from the pair (Banana) would cause an allergy. This process of increasing the expectancy associated with the absent food is called unovershadowing. Stage 3—Violation of learned expectancies: This was the critical stage of the experiment. It involved items that were absent at stage 2 but subject to unovershadowing (represented here by the banana). Half of these items were presented in association with an allergic reaction, half with no allergic reaction. Critically, the trials on which no outcome was presented following unovershadowing should violate the expectation engendered by retrospective revaluation during stage 2. Items associated with an allergic reaction following unovershadowing should fulfill the prediction engendered by the revaluation process. Thus the occurrence of no allergic reaction following banana, should be surprising (i.e. should engender a prediction error).
Fig. 3
Fig. 3. Behavioural performance.
Subjects’ predictive responses are charted (y-axis shows scores based on prediction and confidence as described in the text: a positive value reflects a tendency to predict an outcome, a negative value to predict no outcome; the number refers to the ‘confidence’ expressed in terms of the length of button-push). The evolution of prediction and confidence is depicted across trials (x-axis). An upward deflection represents a tendency to predict with increasing confidence, that a food will cause an allergic reaction. A downward deflection represents a prediction of no allergy. Control data are presented on the left, patient data on the right. Stage 1—Training: The average behavioural response to meals associated with an allergy (red line) and no allergy (green line) are presented. Stage 2—Unovershadowing: Plots show subjects’ predictive responses to single items not paired with an allergy, that were previously presented as part of a pair during stage 1. Stage 3—Predictive response to first presentation during stage 3 of unovershadowed items: This measure is taken as an estimate of the occurrence of unovershadowing during the previous stage. Data on controls and patients are shown.
Fig. 4
Fig. 4. Group differences in brain response to the acquisition of causal associations.
The maximum intensity projection depicts between-group differences in brain responses to basic associative learning. The rendered images show the position of specific regional differences and next to those renderings, the plots display average parameter estimates from those regions for the controls (C) and patients (P).
Fig. 5
Fig. 5. Group differences in brain response to retrospective revaluation of causal associations.
The maximum intensity projection depicts between-group differences in brain responses to unovershadowing. The rendered images show the position of specific regional differences and next to those renderings, the plots display average parameter estimates from those regions for the controls (C) and patients (P), for unovershadowed (Unover) and control items.
Fig. 6
Fig. 6. Group differences in brain response to prediction error.
The maximum intensity projection depicts between-group differences in brain response to prediction error. The rendered image shows the specific position of regional differences. In the adjacent panel, the plot displays average parameter estimates from those regions for the controls (C) and patients (P) for violation and control items.
Fig. 7
Fig. 7. Relating brain response to prediction error with delusion formation.
The rendered image highlights a region of right lateral prefrontal cortex, the activity of which correlates across patients with their delusion severity at the time of scanning. The plot represents this significant relationship. The y-axis represents BPRS unusual thought content score at the time of scanning. The x-axis represents brain activation difference between expected and unexpected events.
Fig. 8
Fig. 8. Dynamic changes in rPFC with trial-by-trial changes in prediction error.
(a) The region of right lateral PFC in which there was a significant relationship between prediction-error changes (as estimated by changing behavioural response) and activation in controls (shown in red). Superimposed on this is the region (shown in yellow) in which there were group differences in this relationship. Specifically, there was an attenuation of this right PFC-prediction-error relationship in the patient group. (b) A surface rendering showing the region of right lateral PFC in which there was a significant inverse correlation between PFC prediction-error response (using the trial-by-trial estimate as for Fig. 8a) and symptoms scores (unusual thought content on BPRS). The plot in Fig. 8c shows this relationship graphically. Specifically, we have plotted across individuals, the BPRS scores against the extent to which lateral PFC activity correlated with out estimate of trial-by-trial prediction error. As can be seen, individuals in whom this relationship was most strongly positive, showed lower scores on this symptom (Pearson’s r = 0.81).

References

    1. Diagnostic and statistical manual of mental disorders - IV. American Psychiatric Association; 2000.
    1. Aitken MR, Dickinson A. Simulations of a modified SOP model applied to retrospective revaluation of human causal learning. Learn Behav. 2005;33:147–59. - PubMed
    1. Altman DG. Practical statistics for medical research. Chapman & Hall/CRC; London: 1991.
    1. Anden NE, Butcher SG, Corrodi H, Fuxe K, Ungerstedt U. Receptor activity and turnover of dopamine and noradrenaline after neuroleptics. Eur J Pharmacol. 1970;11:303–14. - PubMed
    1. Barnett JH, Sahakian BJ, Werners U, Hill KE, Brazil R, Gallagher O, et al. Visuospatial learning and executive function are independently impaired in first-episode psychosis. Psychol Med. 2005;35:1031–41. - PubMed

Publication types

MeSH terms

Substances