. 2007 Sep;171(3):976-92.
doi: 10.2353/ajpath.2007.070345. Epub 2007 Aug 9.

Early axonopathy preceding neurofibrillary tangles in mutant tau transgenic mice

Affiliations

Early axonopathy preceding neurofibrillary tangles in mutant tau transgenic mice

Karelle Leroy et al. Am J Pathol. 2007 Sep.

Abstract

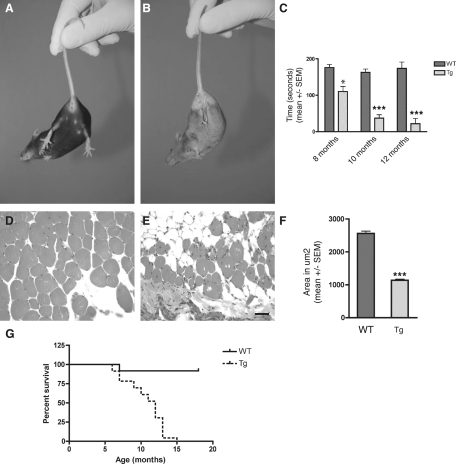
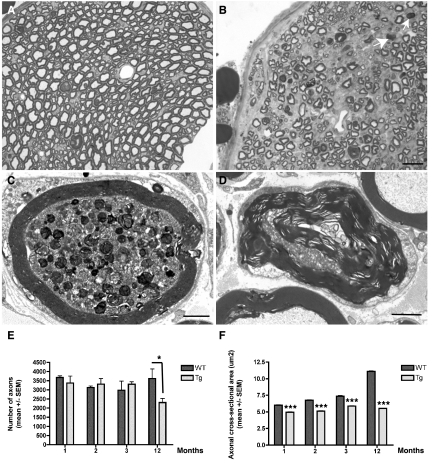
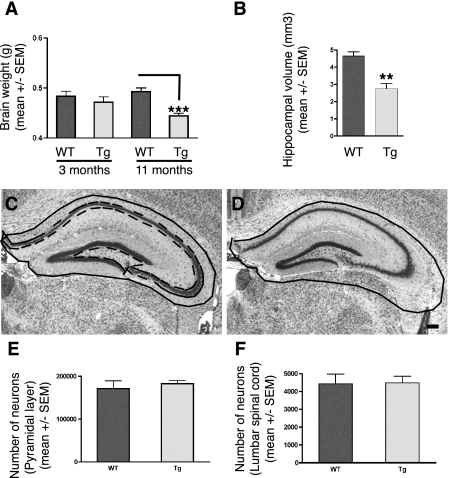
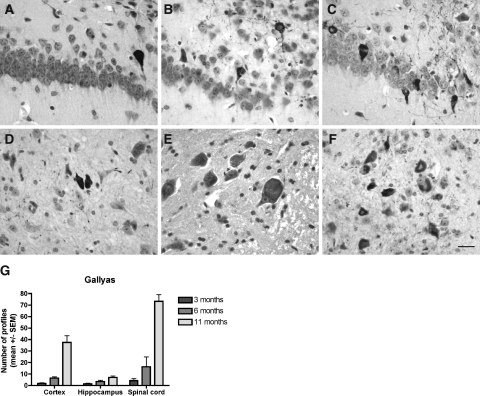
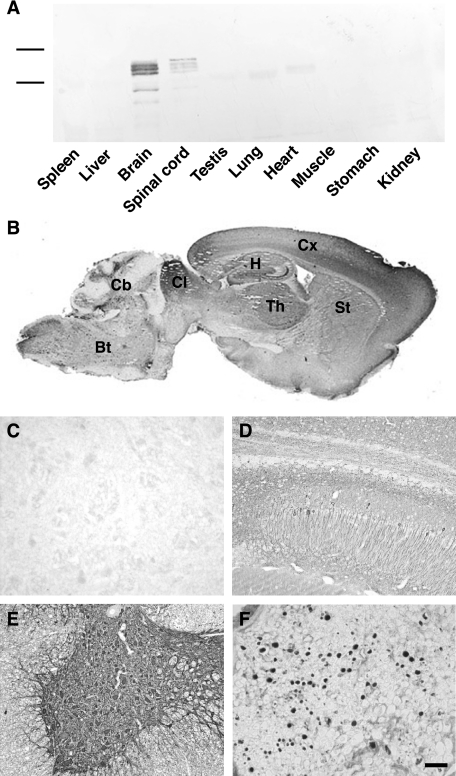
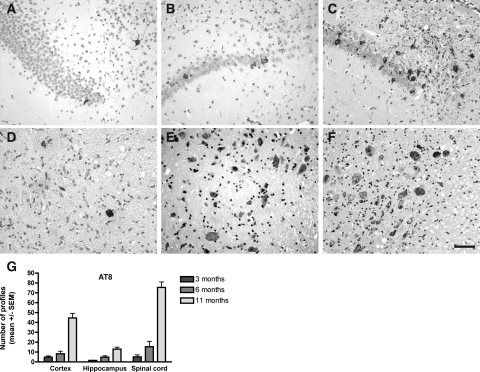
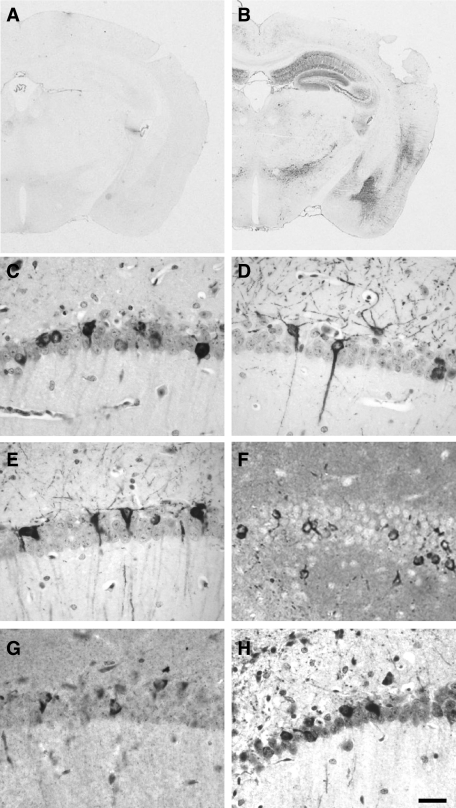
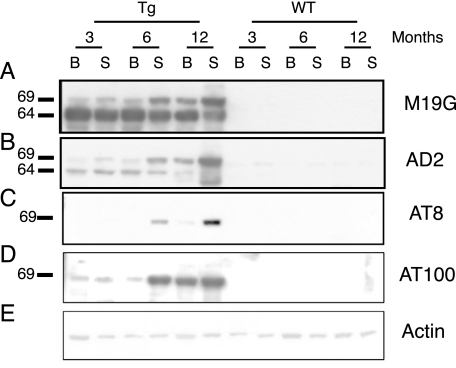
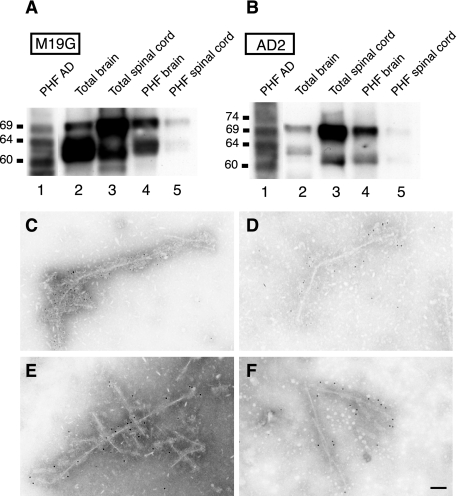
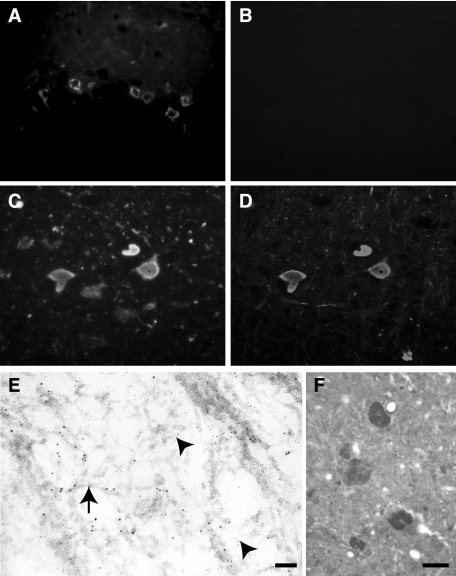
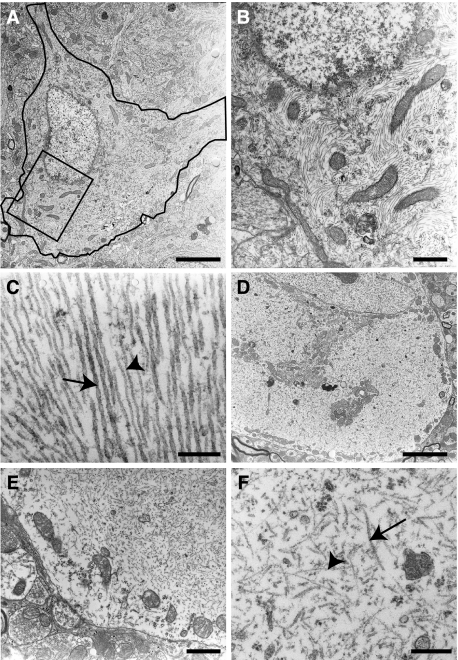
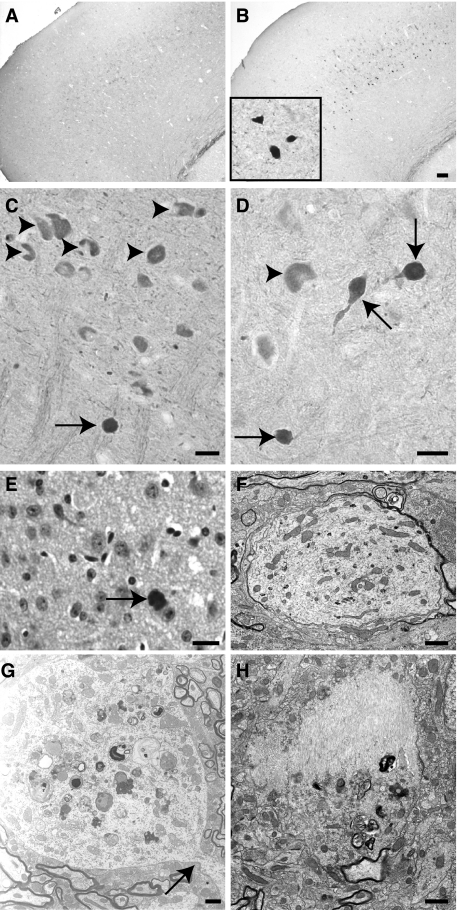
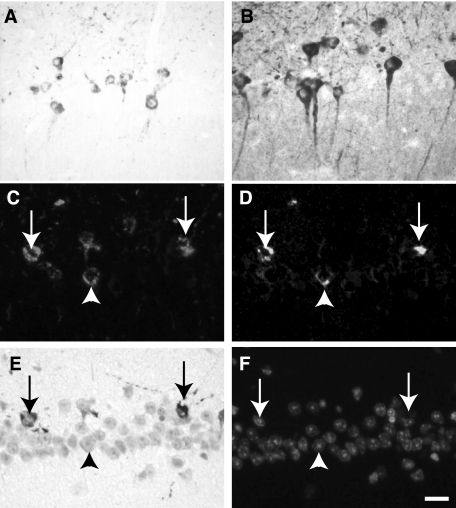
Neurodegenerative diseases characterized by brain and spinal cord involvement often show widespread accumulations of tau aggregates. We have generated a transgenic mouse line (Tg30tau) expressing in the forebrain and the spinal cord a human tau protein bearing two pathogenic mutations (P301S and G272V). These mice developed age-dependent brain and hippocampal atrophy, central and peripheral axonopathy, progressive motor impairment with neurogenic muscle atrophy, and neurofibrillary tangles and had decreased survival. Axonal spheroids and axonal atrophy developed early before neurofibrillary tangles. Neurofibrillary inclusions developed in neurons at 3 months and were of two types, suggestive of a selective vulnerability of neurons to form different types of fibrillary aggregates. A first type of tau-positive neurofibrillary tangles, more abundant in the forebrain, were composed of ribbon-like 19-nm-wide filaments and twisted paired helical filaments. A second type of tau and neurofilament-positive neurofibrillary tangles, more abundant in the spinal cord and the brainstem, were composed of 10-nm-wide neurofilaments and straight 19-nm filaments. Unbiased stereological analysis indicated that total number of pyramidal neurons and density of neurons in the lumbar spinal cord were not reduced up to 12 months in Tg30tau mice. This Tg30tau model thus provides evidence that axonopathy precedes tangle formation and that both lesions can be dissociated from overt neuronal loss in selected brain areas but not from neuronal dysfunction.


Figures

Figure 1
Figure 1
A and B: Tail test showing the abnormal limb-clasping reflex in a 12-month-old Tg30tau transgenic mouse (B) by comparison with an age-matched wild-type mouse (A). C: Rotarod testing of wild-type (n = 4 to 8 for each age) and Tg30tau (n = 7 to 13 for each age) transgenic mice at different ages. The time spent on the rotating rod by Tg30tau mice is already significantly shorter at 8 months and dramatically decreases at 10 and 12 months (two-way analysis of variance with Bonferroni post test). D and E: Tissue section showing the cross-sectional aspect of muscle fibers in the quadriceps femoris of 12-month-old wild-type (D) and Tg30tau (E) mice. F: There is a severe atrophy of muscle fibers in Tg30tau mice, as indicated by an important reduction in the mean cross-sectional area of muscle fibers in 11-month-old Tg30tau mice (n = 10) by comparison with wild-type mice (n = 4) (by Student’s t-test). G: Kaplan-Meier survival curves showing the reduced survival of Tg30tau mice (P < 0.0001, by log-rank comparison). *P < 0.05, ***P < 0.001. Scale bar = 60 μm.
Figure 2
Figure 2
A and B: Semithin transverse sections of the sciatic nerve of 12-month-old wild-type (A) and Tg30tau (B) mice. There is a loss of myelinated axons in the Tg30tau mouse, and myelin ovoids are observed (arrows in B). C and D: Ultrastructural section of the sciatic nerve of Tg30tau mice. C: An axon shows accumulation of dense and lamellar bodies and degenerating mitochondria in a 3-month-old mouse. D: A degenerating axon is surrounded by a myelin sheath showing Wallerian degeneration in a 12-month-old mouse. E: The mean number of axonal profiles in transversal sections of the sciatic nerve is similar in young adult wild-type and Tg30tau mice but is significantly decreased in aged Tg30tau mice (n = 3 to 5 for wild-type and n = 3 to 6 for Tg30tau mice, at each age) (two-way analysis of variance with Bonferroni post test). F: The mean cross-sectional area of axons in the sciatic nerve is smaller in Tg30tau mice and increases with age in wild-type but not in Tg30tau mice (same animals as in E) (two-way analysis of variance with Bonferroni post test). *P < 0.05, ***P < 0.001. Scale bars: 5 μm (A and B); 1.5 μm (C and D).
Figure 3
Figure 3
A: Brain weights of wild-type (n = 4 at 3 and 11 months) and Tg30tau (n = 4 at 3 months and n = 11 at 11 months) mice. The mean brain weight of Tg30tau mice is significantly decreased at 11 months of age but not at 3 months of age. ***P < 0.001 (one-way analysis of variance with Bonferroni post test). B: Hippocampal volumes of wild-type (n = 3) and Tg30tau (n = 4) mice at 12 months. The mean volume of the hippocampus is significantly decreased in 12-month-old Tg30tau mice. **P < 0.01 (by Student’s t-test). C and D: The neuroanatomical limits used for delineation of the hippocampal formation is shown as a solid black line in a wild-type mouse in C and is superposed on the hippocampal formation of a Tg30tau mouse in D to illustrate the decreased hippocampal area in the latter. The dashed line in C represents the limit of the area used to determine cell number in the pyramidal layer. E and F: Stereological analysis of cell number in the hippocampal pyramidal cell layer (E) and anterior horn of the lumbar spinal cord (F) of 12-month-old wild-type (n = 3) and Tg30tau (n = 3) mice. Total neuron numbers in the pyramidal layer of the hippocampus (E) and neuron numbers in the anterior horn of a limited segment of the lumbar spinal cord (F) of wild-type and Tg30tau mice were not different. Scale bar = 150 μm.
Figure 4
Figure 4
A–F: Gallyas silver staining on tissue section of the hippocampus and subiculum (A–C) and the spinal cord (D–F) of Tg30tau mice. A–C: Gallyas-positive neuronal inclusions are detected in the pyramidal layer and the subiculum in 3-month-old Tg30tau mice (A) and increase in number in 6-month-old (B) and 12-month-old (C) mice. D–F: Gallyas-positive neuronal inclusions are detected in neurons in the anterior horn of the spinal cord in 3-month-old Tg30 mice (D) and increase in number in 6-month-old (E) and 12-month-old (F) mice. G: Quantification of Gallyas-positive neuronal inclusions in cortex, hippocampal pyramidal layer, and lumbar gray matter of the spinal cord in 3-month-old (n = 6), 6-month-old (n = 5), and 12-month-old (n = 10) Tg30 tau mice, expressed as the mean number of Gallyas-positive profiles per tissue section. Scale bar = 15 μm.
Figure 5
Figure 5
A: Western blotting analysis of the expression of the human tau transgenic protein in different organs of Tg30 mice with a human-specific antibody to tau. This expression is limited to brain and spinal cord. B–F: Immunocytochemical labeling with the human-specific antibody to tau. B: Low-magnification sagittal section of the brain of a 6-month-old Tg30tau mouse showing widespread expression of human tau in cortex (Cx), hippocampus (H), striatum (St), thalamus (Th), colliculus (CL), cerebellum (Cb), and brainstem (Bt). C–F: Higher magnification showing the strong expression of human tau in the pyramidal layer of the hippocampus (D), in the gray matter of the spinal cord (E), in the sciatic nerve (F), and its absence in the spinal cord of a wild-type mouse (C). Scale bar = 40 μm.
Figure 6
Figure 6
A–F: AT8 immunolabeling on tissue section of the hippocampus and subiculum (A–C) and the spinal cord (D–F) of Tg30tau mice. Neurons with an AT8-positive somatodendritic labeling are detected in the pyramidal layer and the subiculum and in the spinal cord in 3-month-old Tg30tau mice (A and D) and increase in number in 6-month-old (B and E) and 12-month-old (C and F) mice. G: Quantification of AT8-positive neurons in cortex, hippocampal pyramidal layer, and lumbar gray matter of the spinal cord in 3-month-old (n = 6), 6-month-old (n = 5), and 12-month-old (n = 10) Tg30 tau mice, expressed as the mean number of AT8-positive profiles per tissue section. Scale bar = 20 μm.
Figure 7
Figure 7
Immunocytochemical labeling with tau antibodies in 12-month-old Tg30tau mice. A and B: Low magnification showing the immunolabeling with the phospho-dependent tau antibody AT8 on a coronal section of a wild-type (A) and a Tg30tau (B) mouse. Note the strong AT8 labeling in the hippocampus and in the temporal cortex. C–H: Immunolabeling of NFTs on tissue section of the pyramidal layer of the hippocampus with the phospho-dependent tau antibodies AT180 (C) and PHF-1 (D), the conformation-dependent tau antibody MC1 (E), the phosphotyrosine 4G10 antibody (F), the anti-cleaved tau (Asp421) antibody (G), and the anti-ubiquitin antibody (H). Scale bar = 50 μm.
Figure 8
Figure 8
Western blot analysis of homogenates of brain (B) and spinal cord (S) of Tg30tau and wild-type mice at 3, 6, and 12 months of age. Equivalent protein yields (100 μg) were loaded in each lane. A: M19G human-specific tau antibody. The human transgenic tau protein is present at all ages inTg30 mice (and not in wild-type) as a 64-kd species but a slower migrating species of 69 kd is also detected at low level at 3 months and at higher level in 6- and 12-month-old Tg30tau mice. B: AD2 phosphotau antibody. The antibody detects both the 64- and the 69-kd species in Tg30tau mice, already at 3 months. C: AT8 phosphotau antibody. The antibody detects only the 69-kd species, a strong signal being first seen at 6 months in the spinal cord. D: AT100 conformation-dependent phosphotau antibody. The antibody detects only the 69-kd species, already at 3 months and in both the brain and the spinal cord. E: Actin antibody, used as a control for protein loading. The numbers on the left refers to the positions of PHF-tau proteins of 69 and 64 kd.
Figure 9
Figure 9
A and B: Western blot analysis with the human-specific antibody M19G (A) and the phospho-dependent tau antibody AD2 (B) of Sarkosyl-insoluble fractions from human AD brain (lanes 1), brain homogenates (lanes 2), spinal cord homogenates (lanes 3), and Sarkosyl-insoluble fractions from brain (lanes 4) and spinal cord (lanes 5) of 12-month-old Tg30tau mice. The 69- and a 64-kd species are detected in homogenates and Sarkosyl-insoluble fractions with both antibodies in Tg30tau mice, but the 69-kd species is more intensely immunoreactive than the 64-kd species with the AD2 antibody. Equivalent protein yields (100 μg) were loaded in lanes 2 and 3; similar volumes of resuspended Sarkosyl-insoluble material were loaded in lanes 4 and 5, but this material was obtained starting with 10 times more tissue weight for the brain by comparison with spinal cord. C–F: Immunogold labeling in electron microscopy of abnormal filaments present in the Sarkosyl fractions prepared from brain (C and E) and spinal cord (D and F) of Tg30tau mice. Filaments are labeled by the human-specific tau antibody TP20 (C and D) and the phospho-dependent tau antibody AT8 (E and F). Scale bar = 25 nm.
Figure 10
Figure 10
A–D: Double immunolabeling on tissue sections of the pyramidal layer of the hippocampus (A and B) and the anterior horn of the spinal cord (C and D) with the AT8 antibody (A and C) and the anti-neurofilament M antibody (B and D). The somatodendritic accumulation of phosphotau is associated to a neurofilament accumulation in motorneurons in the spinal cord but not in the pyramidal neurons in the hippocampus. E: Double immunogold labeling in electron microscopy (ultrathin section) of filaments present in a cytoplasmic inclusion in a spinal cord motor neuron with the AT8 (10-nm gold particles, arrows) and the anti-neurofilament M (5-nm gold particles, arrowheads) antibodies. F: Immunolabeling of cytoplasmic inclusions in spinal cord motorneurons with the anti-ERK1 antibody. Scale bars: 20 μm (A–D, F); 120 nm (E).
Figure 11
Figure 11
Ultrastructural aspects of fibrillary inclusions in the hippocampus (A–C) and in the spinal cord (D–F) of Tg30tau mice. A: A pyramidal neuron in the Ammon’s horn contains numerous fibrillary inclusions in its cytoplasm. B: Higher magnification of the rectangular area delimited in A. Bundles of filaments are admixed with mitochondria. C: High magnification of a fibrillary inclusion composed of both straight filaments (arrowhead) and twisted filaments (arrow). D: A neuron in the anterior horn of the spinal cord contains a massive cytoplasmic inclusion. Organelles tend to be displaced in the center or at the periphery of the cytoplasm. E: Higher magnification showing the fibrillary aspect of the inclusion in a motor neuron and the peripheral position of mitochondria. F: High magnification of a motor neuron inclusion, showing the presence of both 20-nm straight filaments (arrow) and thin 10-nm filaments (arrowhead). Scale bars: 1 μm (A and D); 100 nm (B, E, and F); 300 nm (C).
Figure 12
Figure 12
A–E: Anti-neurofilament labeling in 1-month-old (A and B) and 12-month-old (C–E) Tg30tau mice. A and B: Cortex. Neurofilament-positive spheroids are present in cortical layers of Tg30tau mice (B and inset in B) but not in wild-type mice (A). C: Spinal cord. Numerous neurons in the anterior horn show neurofilament-positive cytoplasmic inclusions (arrowheads). An axonal spheroid is also labeled (arrow). D: Brainstem. Three labeled spheroids continuous with small processes (arrows) are adjacent to a neuron with a positive cytoplasmic inclusion (arrowhead). E: Cortex. A labeled spheroid is identified (arrow). F–H: Ultrastructural aspects of axonal dilatations in Tg30tau mice. F: Hippocampal pyramidal layer. An axonal dilatation with an atrophic myelin sheath contains a disordered accumulation of mitochondria, membranous profiles, microtubules, and neurofilaments. G: Spinal cord. A marked neuritic dilatation contains accumulations of abnormal mitochondria, multilamellar and dense bodies, and Golgi stacks. The dilatation has a neck continuous with a process (arrow). H: Hippocampal pyramidal layer. A process contains a thick bundle of abnormal filaments adjacent to an abrupt accumulation of lamellar and dense bodies. Scale bars: 40 μm (A and B); 20 μm (C and D); 15 μm (E); 1.5 μm (F and H); 2.5 μm (G).
Figure 13
Figure 13
Immunocytochemical labeling on tissue section of the pyramidal layer of the hippocampus in 12-month-old Tg30tau mice. A and B: Immunolabeling of NFTs with the antibody to active Jun kinase (A) and to active GSK-3 (B). C–F: Quadruple labeling combining a double immunolabeling with the AT8 antibody (C) and the GSK-3 (pTyr216) antibody (D) and double staining with Gallyas (E) and 4,6-diamidino-2-phenylindole (F). Several neurons showing a somatodendritic phosphotau and GSK-3 immunoreactivity also contain Gallyas-positive inclusions (arrows), but some are not Gallyas-positive (arrowheads). Scale bar = 20 μm.

References

    1. Lee VMY, Goedert M, Trojanowski JQ. Neurodegenerative tauopathies. Annu Rev Neurosci. 2001;24:1121–1159. - PubMed
    1. Rodgers-Johnson P, Garruto RM, Yanagihara R, Chen KM, Gajdusek DC, Gibbs CJ., Jr Amyotrophic lateral sclerosis and parkinsonism-dementia on Guam: a 30-year evaluation of clinical and neuropathologic trends. Neurology. 1986;36:7–13. - PubMed
    1. Lomen-Hoerth C, Anderson T, Miller B. The overlap of amyotrophic lateral sclerosis and frontotemporal dementia. Neurology. 2002;59:1077–1079. - PubMed
    1. Kumar-Singh S, Van Broeckhoven C. Frontotemporal lobar degeneration: current concepts in the light of recent advances. Brain Pathol. 2007;17:104–113. - PMC - PubMed
    1. Buée L, Bussière T, Buée-Scherrer V, Delacourte A, Hof PR. Tau protein isoforms, phosphorylation and role in neurodegenerative disorders. Brain Res Rev. 2000;33:95–130. - PubMed

Publication types

MeSH terms

Substances