. 2007 Aug 21;104(34):13672-7.
doi: 10.1073/pnas.0702752104. Epub 2007 Aug 9.

The tight junction protein, MUPP1, is up-regulated by hypertonicity and is important in the osmotic stress response in kidney cells

Affiliations

The tight junction protein, MUPP1, is up-regulated by hypertonicity and is important in the osmotic stress response in kidney cells

Miguel A Lanaspa et al. Proc Natl Acad Sci U S A. .

Abstract

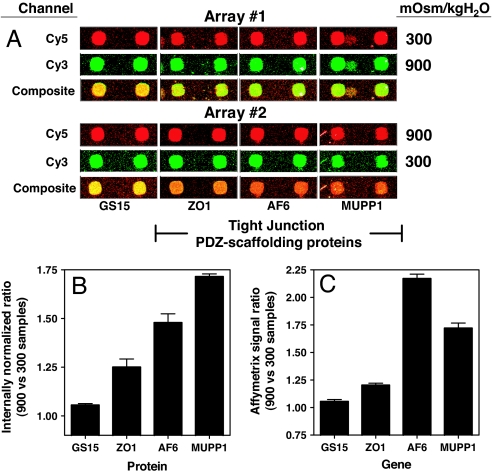
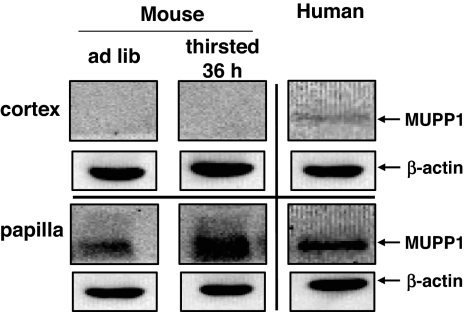
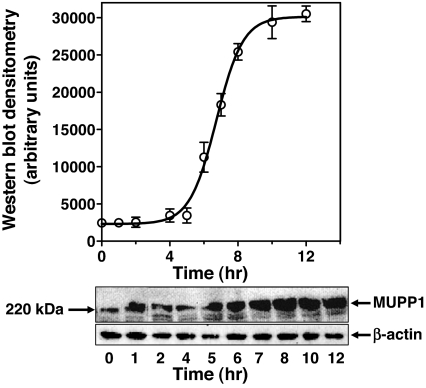
Antibody array proteomics was used to detect differentially expressed proteins in inner medullary collecting duct 3 (IMCD3) cells grown under isotonic and chronic hypertonic conditions. Of 512 potential proteins, >90% were unchanged in expression. Noteworthy was the up-regulation of several tight junction-related proteins, including MUPP1 (multi-PDZ protein-1), ZO1 (zonula occludens 1), and Af6. The most robustly up-regulated protein under hypertonic conditions was MUPP1 (7.2x, P < 0.001). Changes in expression for MUPP1 were verified by quantitative PCR for message and Western blot for protein. In mouse kidney tissues, MUPP1 expression was substantial in the papilla and was absent in the cortex. Furthermore, MUPP1 expression increased 253% (P < 0.01) in the papilla upon 36 h of thirsting. Localization of MUPP1 protein expression was confirmed by immunocytochemical analysis demonstrating only minor staining under isotonic conditions and the substantial presence in chronically adapted cells at the basolateral membrane. Message and protein half-life in IMCD3 cells were 26.2 and 17.8 h, respectively. Osmotic initiators of MUPP1 expression included NaCl, sucrose, mannitol, sodium acetate, and choline chloride but not urea. Stable IMCD3 clones silenced for MUPP1 expression used the pSM2-MUPP1 vector. In cell viability experiments, clones silenced for MUPP1 demonstrated only a minor loss in cell survival under acute sublethal osmotic stress compared with empty vector control cells. In contrast, a 24% loss (P < 0.02) in transepithelial resistance for monolayers of MUPP1-silenced cells was determined as compared with controls. These results suggest that MUPP1 specifically, and potentially tight junction complexes in general, are important in the renal osmoadaptive response.


Conflict of interest statement

The authors declare no conflict of interest.

Figures

Fig. 1.
Fig. 1.
Initial identification of MUPP1 as a potentially up-regulated protein in response to osmotic pressure. (A) Individual spot signal intensity was analyzed with ScanArrayGx/ProScanarray software. Selected antibody pairs for array 1 are compared with the dye swap array 2 and display pseudo colors for Cy3 (green) and Cy5 (red). More than 90% of the array spots demonstrated equal signal intensity (yellow) as illustrated by the response for Golgi vesicle SNARE (soluble N-ethylmaleimide-sensitive factor attachment protein receptor) (GS15) protein. However, spots corresponding to TJ-related PDZ proteins, MUPP1, ZO1, and AF6, showed a substantial increase in signal intensity from hypertonic-adapted cells as shown in the composite spots for both arrays. (B) Composite channel intensity from both arrays was used to calculate the INR of which the majority of proteins demonstrated a no-change value between 0.82 and 1.15. The upper threshold INR value, indicating proteins that are up-regulated at 900 mOsm/kgH2O, was 1.25. (C) Gene chip data (Affymetrix) also shows that message for MUPP1, ZO1, and AF6 is up-regulated in IMCD3 cells adapted to 900 mOsm/kgH2O as compared with isotonic controls.
Fig. 2.
Fig. 2.
Confirmation of changes in message and protein for MUPP1 by QPCR and Western blot. (A) QPCR was performed with MUPP1-specific primers and demonstrated an increase in message for IMCD3 cells adapted to increasing tonicity. (B) Western blot data reveal increased protein expression in IMCD3 cells under acute and chronic exposure to hypertonicity. Data represent the average ± SEM for three independent experiments in triplicate (n = 9) for QPCR, and a representative Western blot including the β-actin loading control is shown.
Fig. 3.
Fig. 3.
MUPP1 protein expression in kidney tissues. Mice kidney tissues (papilla and cortex) were harvested after 36 h of water restriction (thirst) or with ad lib water, and protein homogenates were analyzed by Western blot. Expression of MUPP1 was substantial in mouse kidney papilla as compared with little or no expression in cortex tissues. Water restriction in mice led to a 3-fold increase in MUPP1 protein expression in papilla (P < 0.01). Data represent the mean ± SEM from three Western blots (200 μg total protein per lane, n = 6). A representative Western blot is shown. Comparison of MUPP1 protein expression in human cortex and papilla tissues is shown at the far right. A representative Western blot including the β-actin loading control using 200 μg of total protein per lane (n = 4) is shown.
Fig. 4.
Fig. 4.
Cellular expression of MUPP1 protein in IMCD3 cells chronically adapted to increasing hypertonicity compared with isotonic conditions. Confluent cells were grown in 8-well glass slide chambers and imaged with the polyclonal MUPP1 antibody and an Alexa 488-conjugated secondary antibody. Cell nuclei were stained with DAPI and imaged with a Zeiss LSM 510 confocal laser scanning microscope. (A) Cells grown under isotonic conditions (300 mOsm/kgH2O; Top) demonstrate little MUPP1 protein as compared with cells adapted to 600 (Middle) and 900 mOsm/kgH2O (Bottom). (B) Z-stack view demonstrates MUPP1 staining specifically at the lateral membrane. (Scale bars: 20 μm.)
Fig. 5.
Fig. 5.
Effect of acute sublethal osmotic stress (550 mOsm/kgH2O) on MUPP1 protein expression in IMCD3 cells. Cell lysates (0–12 h) were analyzed by Western blot. Data depict the mean ± SEM from three Western blots (200 μg of total protein per lane, n = 6). A representative Western blot including the β-actin loading control is shown.
Fig. 6.
Fig. 6.
Estimation of half-life for MUPP1 mRNA and protein in IMCD3 cells. Cells chronically adapted to 900 mOsm/kgH2O were changed to isotonic media and message, and protein was measured by QPCR and Western blot, respectively. Data were subjected to decay analysis for message (solid line) and protein (dashed line). The half-life was calculated from the one-phase exponential decay equation. QPCR and Western blot analysis were from three independent experiments performed in duplicate (Western blot; 200 μg of total protein per lane; n = 6).
Fig. 7.
Fig. 7.
Effects of acute osmotic stress using various solutes on MUPP1 protein expression in IMCD3 cells. Solutes were added to increase medium tonicity to 550 mOsm/kgH2O, and cells were exposed for 48 h. Cell lysates were analyzed by Western blot. Data depict the mean ± SEM from six Western blots performed in duplicate (200 μg of total protein per lane; n = 12). Results indicate MUPP1 expression for NaCl, Na acetate, choline chloride, mannitol, and sucrose was significant as compared with the isotonic controls (P < 0.01). In contrast, data for urea were generally equal to or slightly lower than the controls (P > 0.05). A representative Western blot including the β-actin loading control is shown.
Fig. 8.
Fig. 8.
Effect of silencing MUPP1 expression in IMCD3 cells on monolayer TER after adaptation to hypertonicity (550 mOsm/kgH2O). Data represent the TER measurements for IMCD3 cells silenced for MUPP1 expression as compared with empty vector controls grown on membrane supports to confluence. Results indicate a 24% loss in TER for MUPP1-silenced monolayer cultures at day 6 (P < 0.02) as compared with empty vector controls. Data were collected from three identical experimental replicates and represent the mean ± SEM for two independent experiments (n = 6).

Similar articles

Cited by

References

    1. Burg MB, Kwon ED, Kultz D. Annu Rev Physiol. 1997;59:437–455. - PubMed
    1. Ferraris JD, Burg MB. Contri Nephrol. 2006;152:125–141. - PubMed
    1. Handler JS, Kwon HM. Kidney Int. 1996;49:1682–1683. - PubMed
    1. Handler JS, Kwon HM. Nephron. 2001;87:106–110. - PubMed
    1. Tian W, Cohen DM. Am J Physiol. 2002;283:F388–F398. - PubMed

Publication types

LinkOut - more resources