

Amplified transmission of HIV-1: comparison of HIV-1 concentrations in semen and blood during acute and chronic infection
- PMID: 17690570
- PMCID: PMC2673564
- DOI: 10.1097/QAD.0b013e3281532c82
Amplified transmission of HIV-1: comparison of HIV-1 concentrations in semen and blood during acute and chronic infection
Abstract
Objectives: This study was conducted to compare viral dynamics in blood and semen between subjects with antibody negative, acute HIV-1 infection and other subjects with later stages of infection.
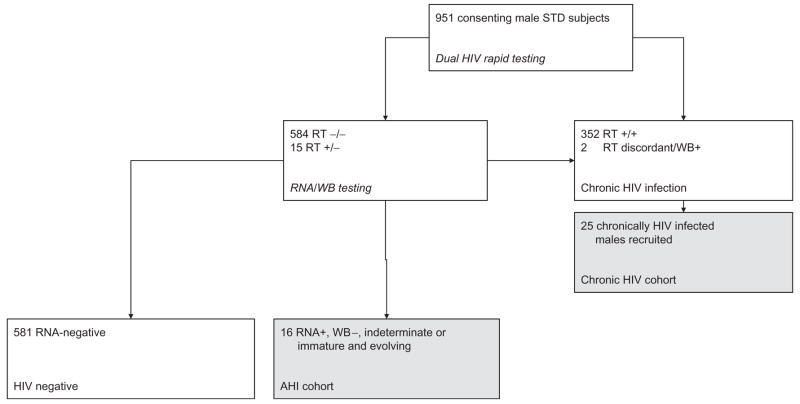
Design: A prospective cohort study was embedded within a cross-sectional study of HIV screening in a Lilongwe, Malawi STD clinic.
Methods: Blood samples from HIV antibody negative or indeterminate volunteers were used to detect HIV RNA in plasma using a pooling strategy. Blood and seminal plasma HIV-1 RNA concentrations were measured over 16 weeks.
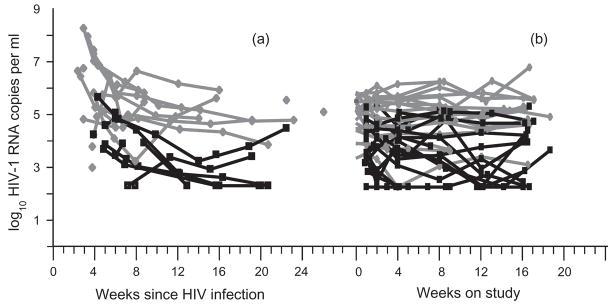
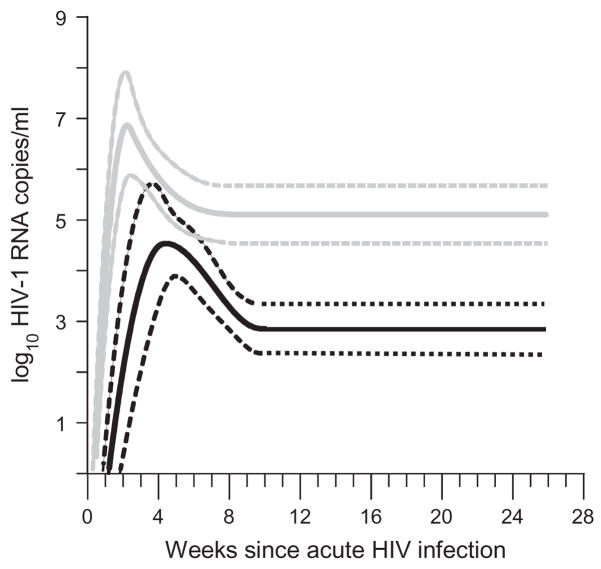
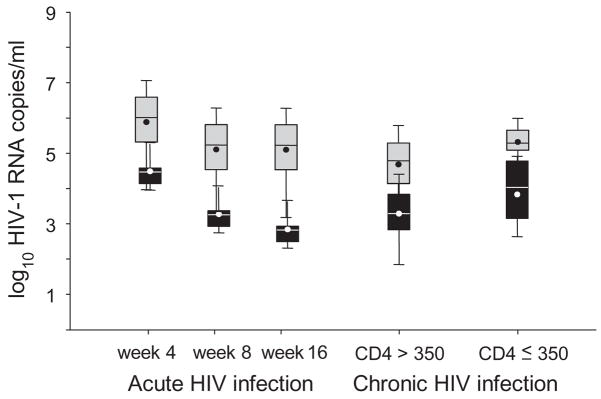
Results: Sixteen men with acute HIV infection and 25 men with chronic HIV infection were studied. Blood viral load in subjects with acute HIV infection was highest about 17 days after infection (mean +/- SE, 6.9 +/- 0.5 log10 copies/ml), while semen viral load peaked about 30 days after infection (4.5 +/- 0.4 log10 copies/ml). Semen viral load declined by 1.7 log10 to a nadir by week 10 of HIV infection. Semen and blood viral loads were more stable in chronically infected subjects over 16 weeks. Higher semen levels of HIV RNA were noted in subjects with low CD4 cell counts.
Conclusions: These results provide a biological explanation for reported increases in HIV transmission during the very early (acute) and late stages of infection. Recognizing temporal differences in HIV shedding in the genital tract is important in the development of effective HIV prevention strategies.
Figures
References
-
- Joint United Nations Programme on HIV/AIDS (UNAIDS) UNAIDS 2006 report on the global AIDS epidemic. http://www.u-naids.org.
-
- Galvin SR, Cohen MS. Sexual transmission of HIV. Nat Rev Microbiol. 2004;2:33–42. - PubMed
-
- Quinn TC, Wawer MJ, Sewankambo N, Serwadda D, Li C, Wabwire-Mangen F, et al. Viral load and heterosexual transmission of human immunodeficiency virus type 1. N Engl J Med. 2000;342:921–929. - PubMed
-
- Wawer MJ, Gray RH, Sewankambo NK, Serwadda D, Li X, Laeyendecker O, et al. Rates of HIV-1 transmission per coital act, by stage of HIV-1 infection, in Rakai, Uganda. J Infect Dis. 2005;191:1403–1409. - PubMed
Publication types
MeSH terms
Substances
Grants and funding
- D43 TW001039/TW/FIC NIH HHS/United States
- K23 AI 01781/AI/NIAID NIH HHS/United States
- T32 AI007001/AI/NIAID NIH HHS/United States
- U19 AI 31496/AI/NIAID NIH HHS/United States
- D43 TW 01039/TW/FIC NIH HHS/United States
- AI 07001/AI/NIAID NIH HHS/United States
- R01 MH068686/MH/NIMH NIH HHS/United States
- 9P30 AI 5041/AI/NIAID NIH HHS/United States
- R01 49381/PHS HHS/United States
- U19 AI031496/AI/NIAID NIH HHS/United States
- U01 AI048005/AI/NIAID NIH HHS/United States
- U19 AI067854/AI/NIAID NIH HHS/United States
- K23 AI001781/AI/NIAID NIH HHS/United States
- R01 MH 068686/MH/NIMH NIH HHS/United States
- U01 AI 48005/AI/NIAID NIH HHS/United States
- P30 AI050410/AI/NIAID NIH HHS/United States
LinkOut - more resources
Full Text Sources
Medical
Research Materials
