. 2007 Sep 5;26(17):3888-99.
doi: 10.1038/sj.emboj.7601819. Epub 2007 Aug 9.

Impaired GABAergic transmission and altered hippocampal synaptic plasticity in collybistin-deficient mice

Affiliations

Impaired GABAergic transmission and altered hippocampal synaptic plasticity in collybistin-deficient mice

Theofilos Papadopoulos et al. EMBO J. .

Abstract

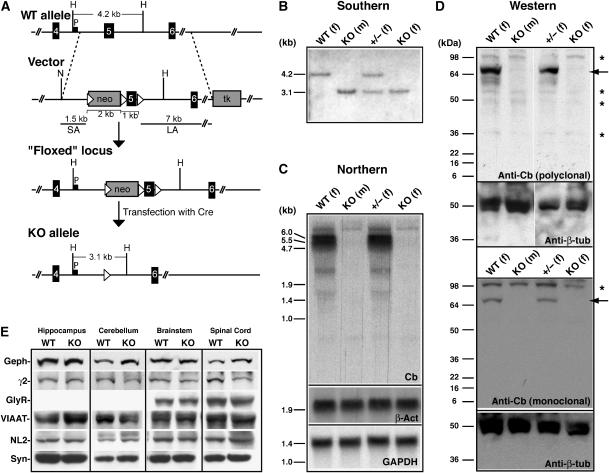
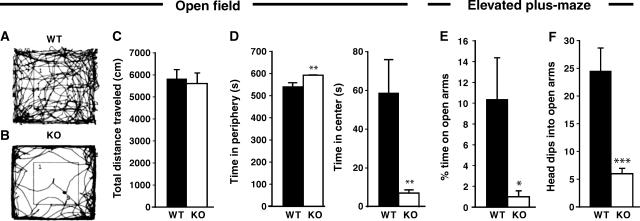
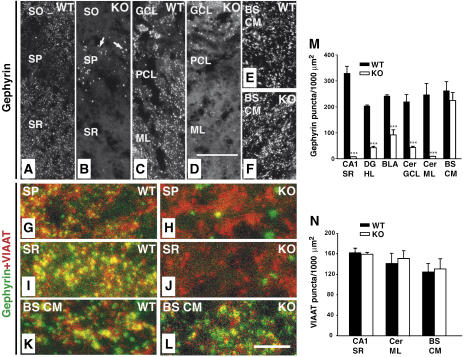
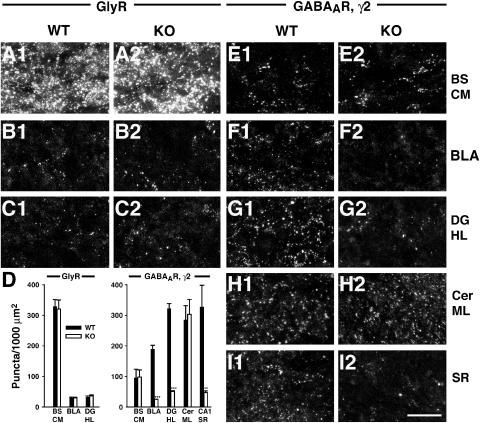
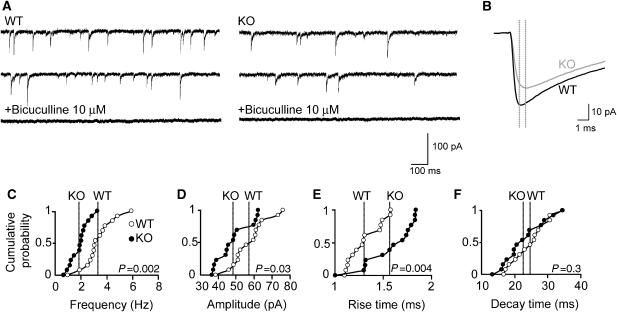
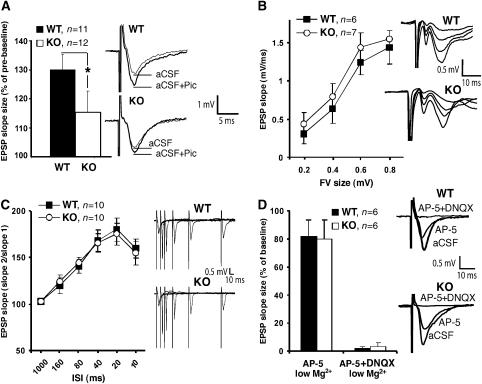
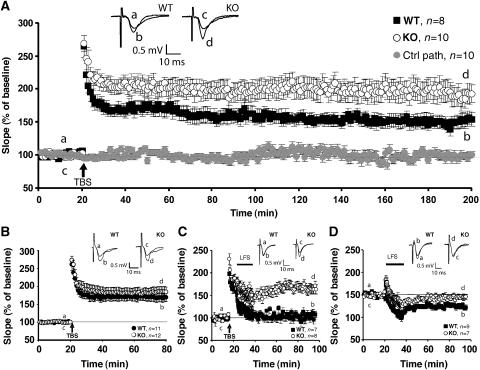
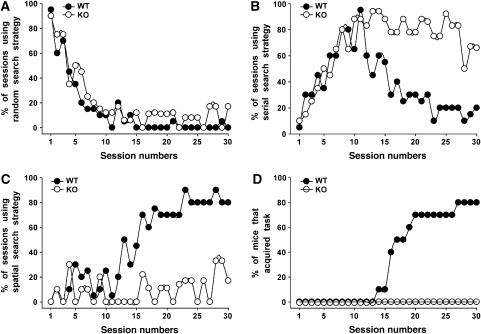
Collybistin (Cb) is a brain-specific guanine nucleotide exchange factor that has been implicated in plasma membrane targeting of the postsynaptic scaffolding protein gephyrin found at glycinergic and GABAergic synapses. Here we show that Cb-deficient mice display a region-specific loss of postsynaptic gephyrin and GABA(A) receptor clusters in the hippocampus and the basolateral amygdala. Cb deficiency is accompanied by significant changes in hippocampal synaptic plasticity, due to reduced dendritic GABAergic inhibition. Long-term potentiation is enhanced, and long-term depression reduced, in Cb-deficient hippocampal slices. Consistent with the anatomical and electrophysiological findings, the animals show increased levels of anxiety and impaired spatial learning. Together, our data indicate that Cb is essential for gephyrin-dependent clustering of a specific set of GABA(A) receptors, but not required for glycine receptor postsynaptic localization.


Figures

Figure 1
Figure 1
Targeted disruption of the mouse Cb gene. (A) Schematic representation of the targeting strategy showing the WT Cb gene, the targeting vector, the ‘floxed' locus and the null allele. Exons are represented as black boxes. The neomycin resistance cassette (neo) and the herpes simplex virus thymidine kinase (tk) gene of the targeting vector are indicated as gray boxes, and loxP sites as triangles. P corresponds to the probe used for Southern analysis. SA, short arm; LA, long arm. Relevant restriction sites indicated are as follows: H, HindIII; N, NotI. (B) Southern blot analysis of HindIII-digested mouse tail DNA from WT, Cb KO and heterozygous (±) offspring. The 4.2 kb and the 3.1 kb bands represent the WT and the KO alleles, respectively. (m), male; (f), female. (C) Upper panel: Northern blot of brain total RNA with a 430-bp cDNA probe encoding exons 1–3 of the mouse Cb gene reveals 5.5 and 6.0 kb Cb transcripts in WT but not in Cb KO mice. Lower panels: control hybridizations with random-primed probes derived from a 714-bp fragment of the mouse β-actin (β-act) cDNA or a 490-bp fragment of the mouse GAPDH cDNA demonstrate that comparable amounts of total RNA were loaded. (D) Western blot analysis of brain homogenates (50 μg protein/lane) using either a polyclonal Cb antibody (upper panel) or a monoclonal antibody specific for the N-terminally located SH3 domain of the Cb protein (lower panel). Note the absence of Cb protein (indicated by arrows) in all KO samples. Asterisks indicate unspecific bands stained under the experimental conditions used. A β-tubulin (β-tub)-specific antibody was used to confirm that roughly equal amounts of protein were loaded. (E) Western blot analysis of crude membrane fractions prepared from different CNS regions of WT and Cb KO mice. Equal amounts of protein (50 μg protein/lane) were loaded and probed with the indicated antibodies. Note that the expression levels of all proteins tested were not significantly different between genotypes; densitometric scanning of the band intensities determined in three independent experiments did not reveal significant differences for any of the immunoreactive bands examined (data not shown). Geph, gephyrin; γ2, GABAAR γ2-subunit; GlyR, glycine receptor; VIAAT, vesicular inhibitory amino acid transporter; NL2, neuroligin 2; Syn, synaptophysin.
Figure 2
Figure 2
Behavior of Cb KO mice and WT littermates in the open field and elevated plus-maze tests. Male Cb KO mice and their WT littermates were tested between 8 and 10 weeks of age (open field, n=10 per group; elevated plus-maze, n=7 per group). All values represent means±s.e.m. (AD) Open field. (A, B) indicate representative paths traveled by a WT (A) and a Cb KO (B) animal during a period of 10 min. (C) No significant differences between genotypes were observed in the total distance traveled in the open field. (D) Cb KO mice showed a strong reduction in the time spent in the center of the open field and stayed significantly longer in the periphery as compared to WT (**P<0.01; Student's t-test). (E, F) Elevated plus-maze. (E) Cb KO mice spent less time on the open arms as compared with WT controls (*P<0.05; Student's t-test). (F) The number of head dips into open arms was strongly reduced with Cb KO animals as compared with WT littermates (***P<0.001; Student's t-test).
Figure 3
Figure 3
Region-specific reduction of synaptic gephyrin staining in the Cb KO CNS. (AL) Sections from adult Cb KO mice and their WT littermates were stained with gephyrin and VIAAT antibodies. (A, B) The punctate staining of sections from KO animals for gephyrin was strongly reduced in the CA1 region of SR and SO as compared with WT sections. Note the significant increase of gephyrin deposits (arrows in B) in the SP of KO sections (A). (C, D) A strong reduction of gephyrin immunoreactivity was also observed in cerebellar regions (GCL, PCL, ML) of Cb KO animals. (E, F) BS CM sections in contrast showed similar densities of gephyrin puncta in both WT and KO animals. (G–L) Double immunostainings of gephyrin and VIAAT puncta in the SP (G, H) and SR (I, J) of the hippocampus, and in brainstem (K, L) of WT and Cb KO mice. Note that, in contrast to the loss of gephyrin puncta seen in (H, J), VIAAT immunoreactivity was unaffected by Cb deficiency (H, I). Scale bars, 32 μm (A–F), 16 μm (G–L). (M, N) Quantification of gephyrin and VIAAT immunoreactivities. For both genotypes, each bar corresponds to mean values (±s.e.m.) obtained with sections from 3–4 individual brains (***P<0.001; Student's t-test). SO, stratum oriens; SP, stratum pyramidale; SR, stratum radiatum; GCL, granule cell layer; PCL, Purkinje cell layer; Cer ML, molecular layer of cerebellum; BS CM, caudal medulla of the brainstem; DG HL, hilus of the dentate gyrus; BLA, basolateral amygdala.
Figure 4
Figure 4
Reduced clustering of the GABAAR γ2-subunit in the hippocampus and basolateral amygdala of Cb KO mice. Sections from adult Cb KO mice and their WT littermates were stained with the GlyR specific mAb4a (AC) or an antibody specific for the γ2-subunit of GABAARs (EI) and processed for confocal microscopy. (A–C) The punctate staining of GlyRs was comparable in BS CM, BLA and DG HL of both Cb KO and WT mice. (D) Quantification of GlyR and GABAAR γ2-subunit immunoreactivities. For both genotypes, each bar corresponds to counts performed on sections from 3–4 individual brains. Data represent means±s.e.m. (**P<0.01; ***P<0.001; Student's t-test). (E, H) In BS CM and Cer ML, γ2-staining was unaffected by the loss of Cb, as compared to controls. (F, G, I) In contrast, the γ2-subunit punctate staining was selectively reduced in the BLA, the hilus of the DG and the CA1 region of SR in Cb KO sections, as compared with WT. Scale bar, 16 μm. BS CM, caudal medulla of the brainstem; BLA, basolateral amygdala; DG HL, hilus of the dentate gyrus; Cer ML, molecular layer of cerebellum; SR, stratum radiatum.
Figure 5
Figure 5
Altered GABAergic mIPSCs in CA1 pyramidal neurons of Cb KO slice preparations. (A) Representative traces of mIPSCs recorded in the absence or presence of the GABAA receptor antagonist bicuculline (10 μM) from WT and Cb KO neurons. (B) Superimposed averaged traces calculated from 3316 (WT) and 1316 (Cb KO) events over a recording period of 15 min. Dotted lines indicate peak positions of mIPSCs in each trace. (CF) Cumulative distributions of mIPSC frequencies (C), amplitudes (D), rise times (E) and decay times (F) recorded from 14 neurons per genotype. In total, 40 351 (WT) and 23 370 (KO) events were analyzed. Each dot represents the mean value for an individual cell. Lines in each cumulative distribution indicate the averaged mean values of WT (open dots) and Cb KO (closed dots). P-values for each cumulative distribution are indicated (two-tailed Mann−Whitney U-test). All experiments were performed in the presence of 1 μM TTX, 10 μM CNQX and 1 μM D-AP5 at a VH of −65 mV.
Figure 6
Figure 6
Analysis of fEPSPs in the hippocampal CA1 region. (A) Left: fEPSP slope size was significantly increased by bath-application of 100 μM picrotoxin. This enhancement was significantly larger in WT as compared with Cb KO mice (*P<0.05; two-tailed Student's t-test). Right: sweeps from individual experiments before (aCSF) and after application of picrotoxin (aCSF+Pic), averaged over three trials. (B) Left: fEPSP slope size at various stimulus intensities (FV: fiber volley). Right: series of original traces recorded from WT and Cb KO slices. (C) Left: paired-pulse facilitation of the fEPSP at various interstimulus intervals (ISI) from Cb KO and WT slices. Right: single sweeps for WT and Cb KO mice recorded at 10–160 ISI. (D) Left: NMDA receptor and AMPA receptor contributions to the fEPSP recorded in the presence of the indicated antagonists under low (0.5 mM) Mg2+ conditions. Right: original traces from individual experiments. In panels A−C, there were no significant differences between KO and WT slices (P>0.1; Student's t-test). All values represent means±s.e.m.
Figure 7
Figure 7
Cb KO mice show changes in synaptic plasticity. (A) LTP was induced in the CA3–CA1 pathway of the hippocampus in slices from WT (n=8) and Cb KO (n=10) mice; for all slices, a control pathway (ctrl path) was also recorded, here shown for the KO slices (n=10). Inset shows sweeps from individual experiments at the time points indicated by a–d, averaged over six trials. The difference between genotypes was highly significant (P<0.001; Student's t-test). (B) As (A), but in the presence of 100 μM picrotoxin (n=11 for WT, n=12 for Cb KO mice, respectively). Note that the difference between genotypes was no longer significant (P=0.38; Student's t-test). (C) For depotentiation experiments, a TBS (100 Hz) was given, followed 5 min later by a 15 min LFS (1 Hz). WT slices (n=7) displayed normal depotentiation (fEPSP amplitude goes back to baseline), whereas Cb KO slices (n=8) showed no depotentiation effect (P<0.001; Student's t-test). Inset shows sweeps from individual experiments as described in panel A. (D) In Cb KO slices, LTD was not induced upon LFS, whereas WT slices showed normal LTD (P<0.01; Student's t-test). Inset shows sweeps from individual experiments as described in panel A.
Figure 8
Figure 8
Barnes maze performance of WT and Cb KO mice. (AC) The percentage of sessions, in which each of the three search strategies, (A) random, (B) serial and (C) spatial, was used by the WT and Cb KO mice, is presented. All sessions included the same number of animals per group (n=10). (D) Plot showing the cumulative percentage of WT and Cb KO mice that had acquired the Barnes maze test over a period of 30 sessions.

Similar articles

Cited by

References

    1. Allison DW, Chervin AS, Gelfand VI, Craig AM (2000) Postsynaptic scaffolds of excitatory and inhibitory synapses in hippocampal neurons: maintenance of core components independent of actin filaments and microtubules. J Neurosci 20: 4545–4554 - PMC - PubMed
    1. Bach ME, Hawkins RD, Osman M, Kandel ER, Mayford M (1995) Impairment of spatial but not contextual memory in CaMKII mutant mice with a selective loss of hippocampal LTP in the range of the theta frequency. Cell 81: 905–915 - PubMed
    1. Barnes CA (1979) Memory deficits associated with senescence: a neurophysiological and behavioral study in the rat. J Comp Physiol Psychol 93: 74–104 - PubMed
    1. Bausen M, Fuhrmann JC, Betz H, O'Sullivan GA (2006) The state of the actin cytoskeleton determines its association with gephyrin: Role of ena/VASP family members. Mol Cell Neurosci 31: 376–386 - PubMed
    1. Bear MF, Abraham WC (1996) Long-term depression in hippocampus. Annu Rev Neurosci 19: 437–462 - PubMed

Publication types

MeSH terms