. 2007 Oct;160(1):70-82.
doi: 10.1016/j.jsb.2007.06.010. Epub 2007 Jul 10.

Concatenated metallothionein as a clonable gold label for electron microscopy

Affiliations

Concatenated metallothionein as a clonable gold label for electron microscopy

Christopher P Mercogliano et al. J Struct Biol. 2007 Oct.

Abstract

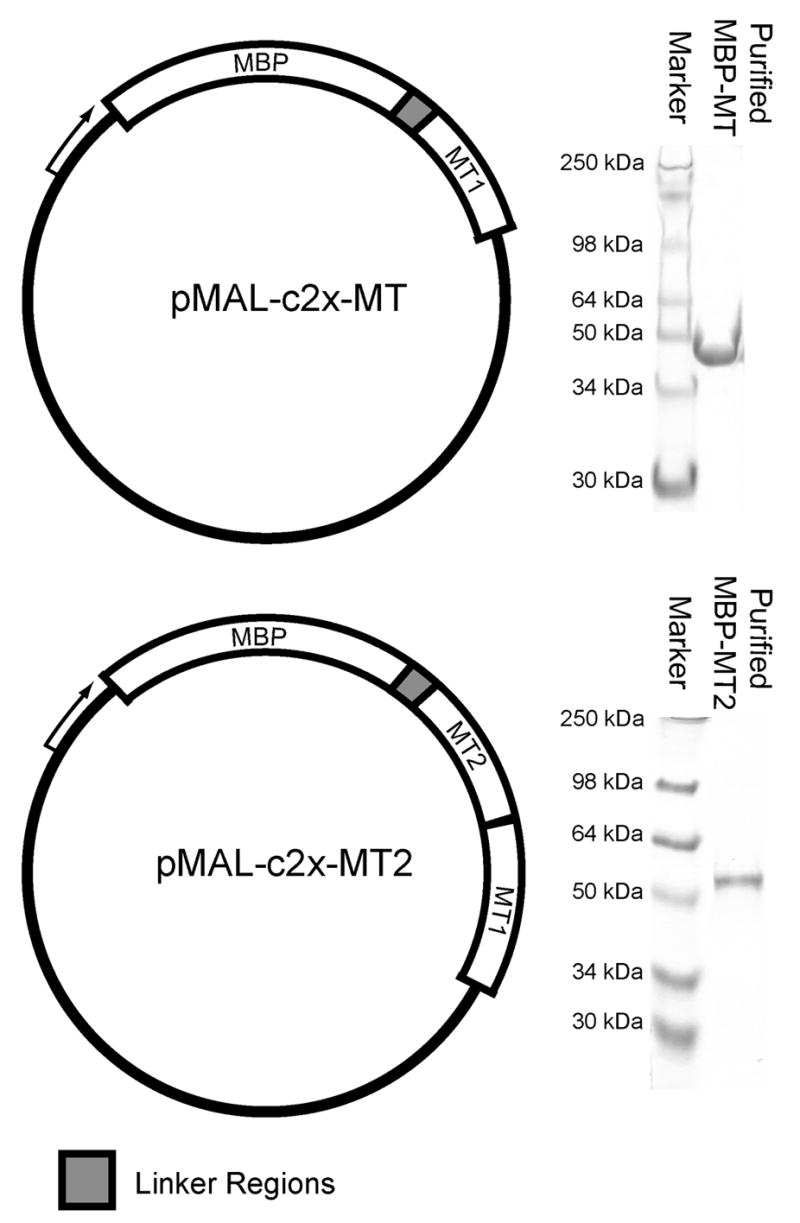
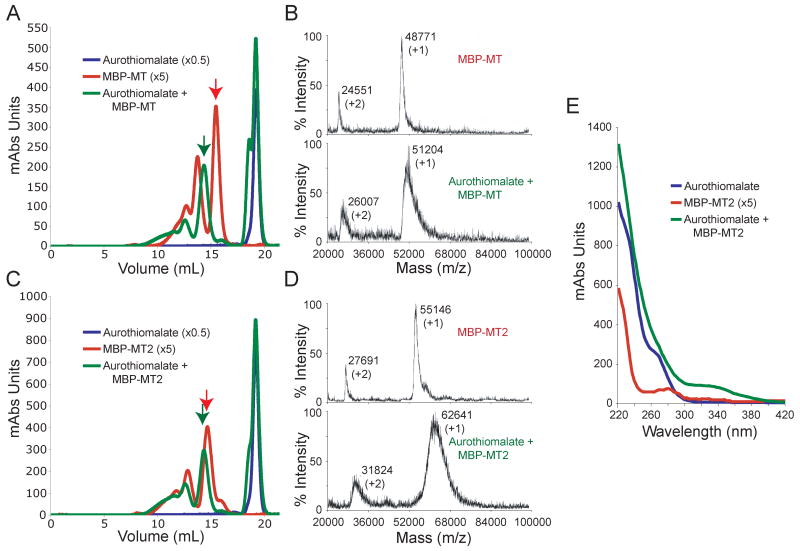
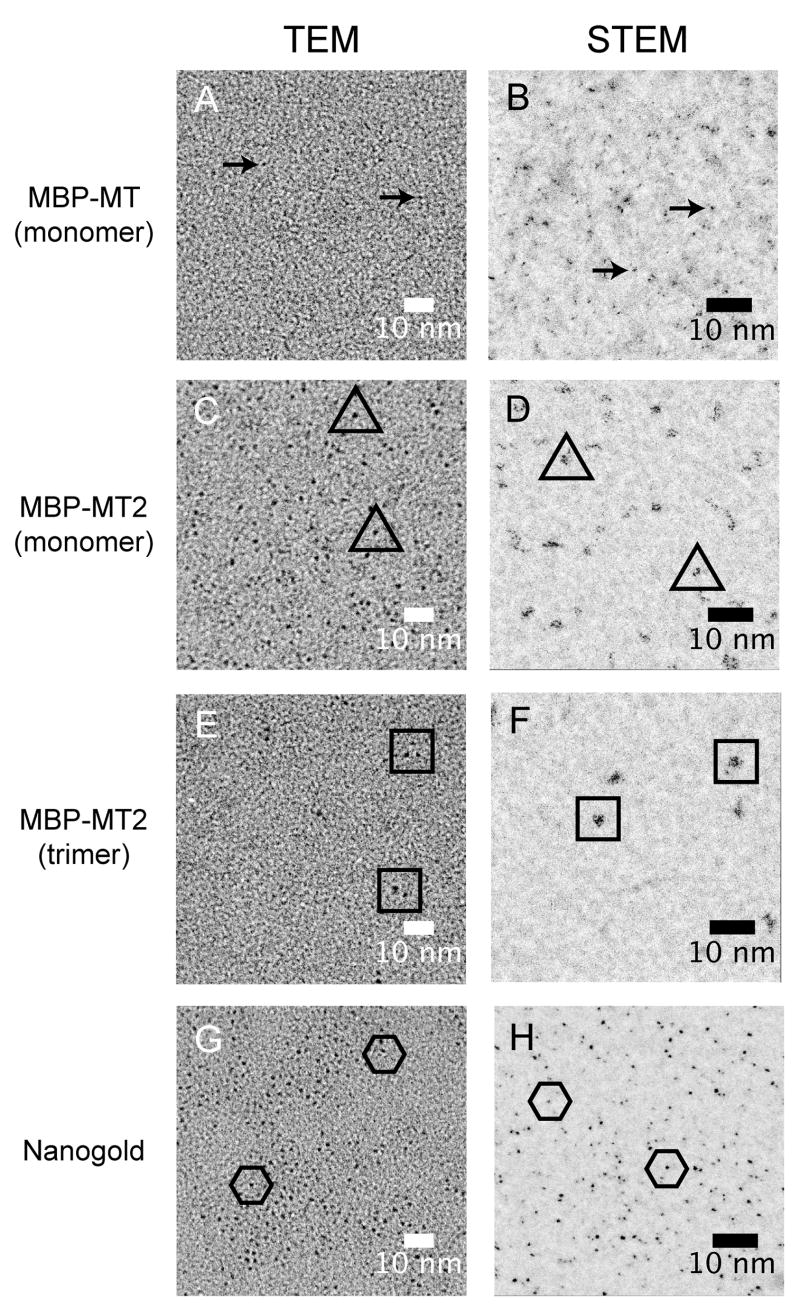
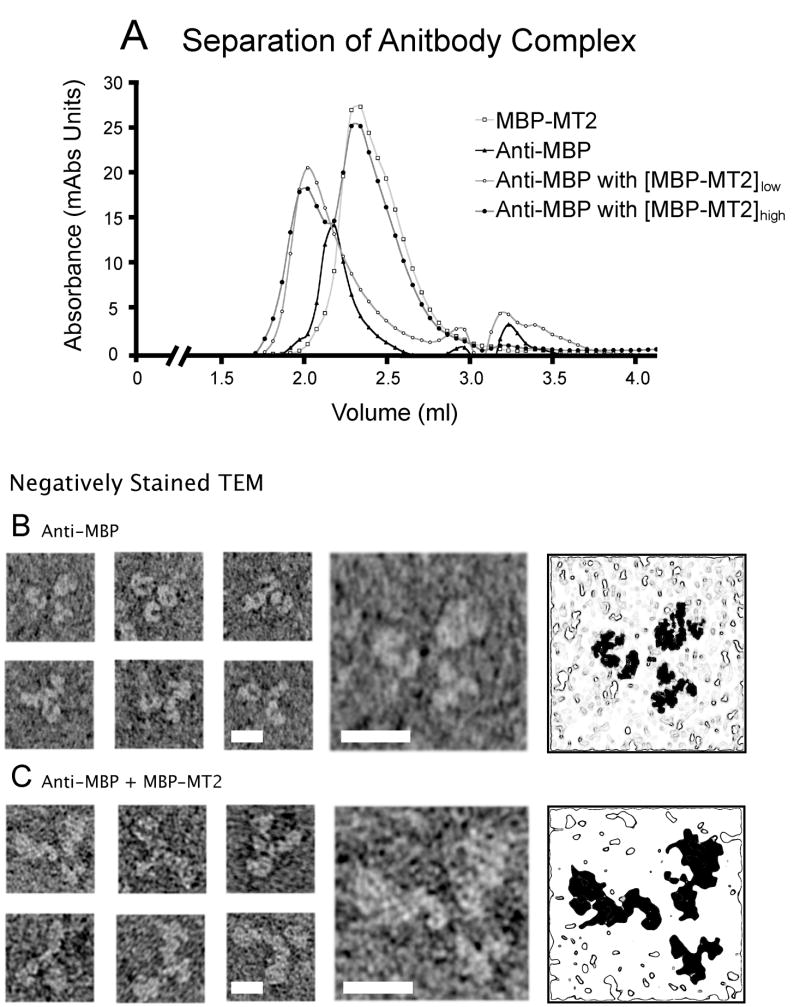
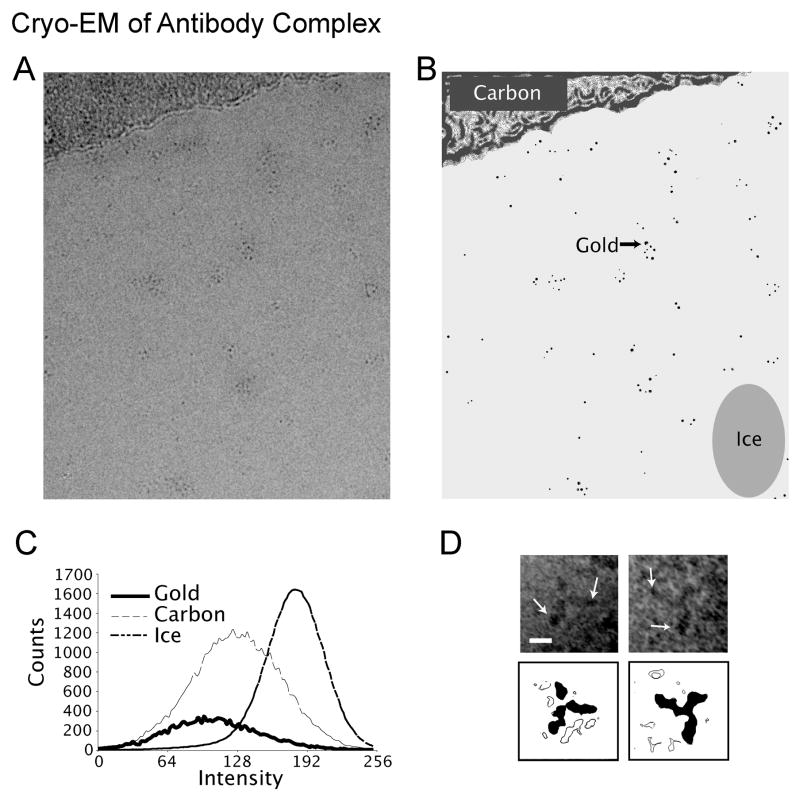
Localization of proteins in cells or complexes using electron microscopy has mainly relied upon the use of heavy metal clusters, which can be difficult to direct to sites of interest. For this reason, we would like to develop a clonable tag analogous to the clonable fluorescent tags common to light microscopy. Instead of fluorescing, such a tag would initiate formation of a heavy metal cluster. To test the feasibility of such a tag, we exploited the metal-binding protein, metallothionein (MT). We created a chimeric protein by fusing one or two copies of the MT gene to the gene for maltose binding protein. These chimeric proteins bound many gold atoms, with a conservative value of 16 gold atoms per copy of metallothionein. Visualization of gold-labeled fusion proteins by scanning electron microscopy required one copy of metallothionein while transmission electron microscopy required two copies. Images of frozen-hydrated samples of simple complexes made with anti-MBP antibodies hint at the usefulness of this method.


Figures

Figure 1
Figure 1
Cloning and purification of MBP fusion proteins with MT. (top, left) MBP was cloned as a fusion protein to a single copy of mouse MT-1 as shown by the plasmid map describing the layout of the pMAL-c2x-MT plasmid. (top, right) After expression and purification, SDS-PAGE showed highly purified MBP-MT protein. (bottom, left) The plasmid, pMAL-c2x-MT2, able to express MBP fused to concatenated MT was created by inserting a second copy of the gene in front of the existing copy. (bottom right) This plasmid was used to express and purify MBP-MT2 as shown by SDS-PAGE.
Figure 2
Figure 2
Gold Binding by MBP fusion proteins. (A and C) Chromatography on a Superdex 10/30HR column shows distinguishable peaks associated with gold-bound MBP-MT and MBP-MT2 fusion proteins. Proteins treated with aurothiomalate (green) or untreated protein (red) are cleanly separated from aurothiomalate run separately (blue). Purified proteins (red) show complete separation from unbound gold (blue) and later elution as compared to gold-bound peaks (green). Note that aurothiomalate incubated protein is shifted to earlier elution compared to untreated protein samples. The unreacted aurothiomalate appears as a peak with a slightly faster shoulder corresponding to released thiomalate, which are probably thiomalate dimers; All profiles were collected at 280nm and scaling factors (in parentheses) were used to compare results because of a gold-associated absorbance. (B and D) Monomeric peaks of wild type and gold-bound protein (red and green arrows) were further analyzed by MALDI mass spectrometry. In each case, gold-incubated proteins (bottom spectra) are shifted to higher mass-to-charge values than the wild-type proteins (top spectra). For each peak shown, the mass-to-charge value corresponding to the maximum observed amplitude is listed as well as the charge state of the peak (in parentheses). (E) Absorbance vs. wavelength spectra for aurothiomalate (blue), a 5x scaled MBP-MT2 (red), and gold-incubated MBP-MT2 (green) samples. Upon gold incubation a shoulder above 300nm emerges
Figure 3
Figure 3
Visual comparison of gold-incubated MT fusion proteins. To test the visibility of gold-incubated MBP fusion protein with MT, samples were spotted on to thin carbon foils and visualized by TEM (left panel) and STEM (right panels). Gold clusters can be seen as the very dark spots in these images. Example clusters for each case are denoted by arrows or at the center of open symbols for each sample. Additional clusters can also be seen, especially in images from MBP-MT2 and the Nanogold®. Gold incubated samples of monomeric MBP-MT (A and B) are not as visible as gold incubated monomeric MBP-MT2 (C and D). To insure that MBP-MT2 sample (C and D) were monomeric, the chromatography peak associated with trimer was also visualized. As expected, groups of two of three clusters were observed (E and F). As a control, 1.4nm Nanogold® clusters were also imaged (G and H).
Figure 4
Figure 4
Visualization and analysis of MBP-MT2 gold clusters. (A) For analysis, images (left) were taken at about 500 nm, 750 nm, and 1.0 μm defocus. From these images, rotational power spectra were calculated and plotted to determine the locations of the zeros within each contrast transfer function (CTF) and according the exact defocus of each image. Scale Bar = 4 nm (B) HRTEM corrected image and particle size analysis of MBP-MT2 gold clusters. The enhanced, corrected image (left) was calculated after CTF correcting, aligning, and averaging the three defocused images. To determine the area associated with each particle, a binary image was produced (center). The intensity threshold value used to produce this binary image was determined by choosing a value that best approximated the area of the particles without selection of pixels within the background carbon. An image produced (right) by subtracting the corrected image (left) from the binary image (center) shows that the best threshold value produces an underestimate of particle size by 1 to 2 pixels along the edge of each particle as witnessed by the white glow around the black particles. Scale bar = 4 nm (left) and 2 nm (right) (C) Particle analysis from the underestimated binary images produces a skewed distribution (circles, dashed line) with an average diameter with a peak at about 1.05 nm. A cumulative distribution function produced from this distribution shows a 50% point at about 1.18 nm. Correcting the underestimate by 2 to 4 pixels, we suggest a 50% point of between 1.30 nm to 1.43 nm.
Figure 5
Figure 5
Preparation of gold-labeled MBP-MT antibody complex. (A) Antibody complexes composed of anti-MBP antibody and gold-incubated MBP-MT2 were prepared on a Superose 12 column. Incubation with low (open circles) and high (closed circles) concentrations of MBP-MT2 resulted in a peak at about 2ml. This was clearly separated from gold-incubated MBP (open squares) and an anti-MBP peak (closed triangles). To guarantee the saturation of antigen binding sites, only the first elution peak from incubations with excess MBP-MT2 (closed circles) was used for EM. For the antibody and antibody images shown, the gallery of images in the left three columns shows typical views of stained complex. The right two columns show an enlarged image of the first image of each set (4th column) and a contour map with the location of the protein shaded in black. (B) Antibodies without MBP-MT2 show the signature similarly sized triple-armed appearance in negative stain. (C) This appearance is in contrast the two large and on small domain appearance of antibody complex. This is best seen in the enlarged image that shows two arms that are significantly larger than the third. All scale bars = 10 nm.
Figure 6
Figure 6
Potential use of gold-labeled MBP-MT2 (A) Cryo-EM images of antibody complexes frozen within the holes of carbon films show the potential usefulness of this method. The low (about −1 μm) defocus image shows diffuse spots that likely result from gold particles. The spots appear to be in clusters suggesting some degree of aggregation of antibody complex. The schematic image (B) is shown as an aid to interpret the image shown in (A). To help verify the identity of the gold, a CTF-corrected image was sampled and analysed for the intensity values found within the image. The solid areas in the schematic image show the locations of pixel intensity sampling used for this analysis. All presumed gold areas, which were masked out with surrounding ice areas, were totalled as one area. (C) The graph shows the distribution of pixel intensities determined by the pixel intensity analysis. The presumed gold areas show intensity values darker than the thick carbon film used as a support and thus suggest their identity as gold. (D) With a combination of complex flexibility, variation in orientation, and some degree of aggregation, EM images from cryo-prepared antibody complex only occasionally show the characteristic views seen in negative stain. Areas of darker density (arrows) can sometimes be seen at the ends of the longer arms of the density; thee are presumably due to the gold clusters and thus hint at the potential of this method.

References

    1. Abramoff MD, Magelhaes PJ, Ram SJ. Image Processing with ImageJ. Biophotonics International. 2004;11:36–42.
    1. Adams SR, Campbell RE, Gross LA, Martin BR, Walkup GK, Yao Y, Llopis J, Tsien RY. New biarsenical ligands and tetracysteine motifs for protein labeling in vitro and in vivo: synthesis and biological applications. J Am Chem Soc. 2002;124:6063–6076. - PubMed
    1. Bohm J, Frangakis AS, Hegerl R, Nickell S, Typke D, Baumeister W. Toward detecting and identifying macromolecules in a cellular context: template matching applied to electron tomograms. Proc Natl Acad Sci U S A. 2000;97:14245–14250. - PMC - PubMed
    1. Gutierrez E, Powell RD, Furuya FR, Hainfeld JF, Schaaff TG, Shafigullin M, Stephens PW, Whetten RL. Greengold, a giant cluster compound of unusual electronic structure. Eur Phys J D. 1999;9:647–651.
    1. Hainfeld JF, Powell RD. New frontiers in gold labeling. J Histochem Cytochem. 2000;48:471–480. - PubMed

Publication types

MeSH terms