. 2007 Aug;12(2):115-30.
doi: 10.1016/j.ccr.2007.07.004.

Frequent engagement of the classical and alternative NF-kappaB pathways by diverse genetic abnormalities in multiple myeloma

Affiliations

Frequent engagement of the classical and alternative NF-kappaB pathways by diverse genetic abnormalities in multiple myeloma

Christina M Annunziata et al. Cancer Cell. 2007 Aug.

Abstract

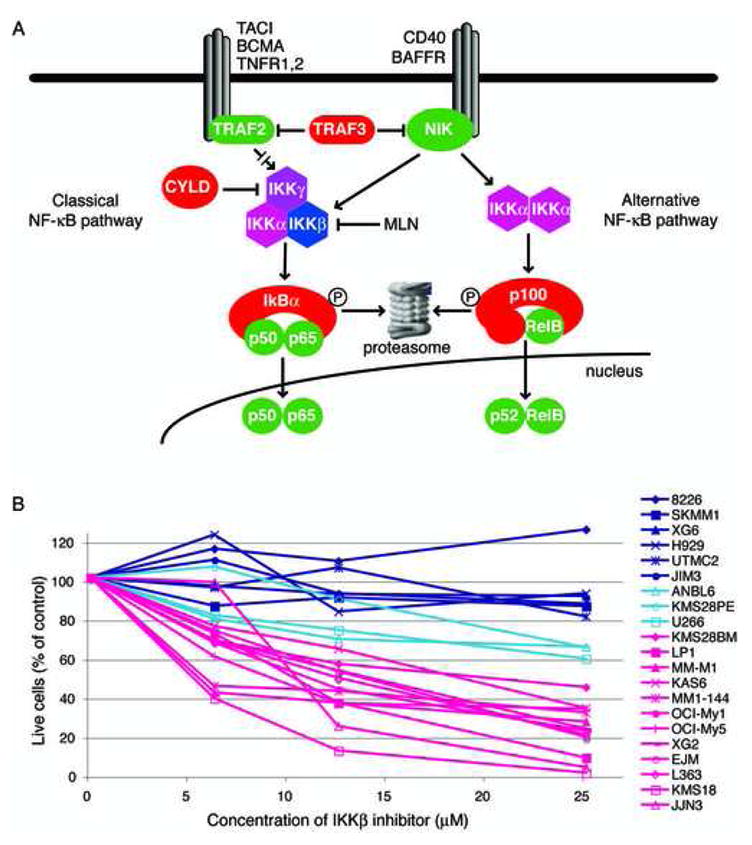
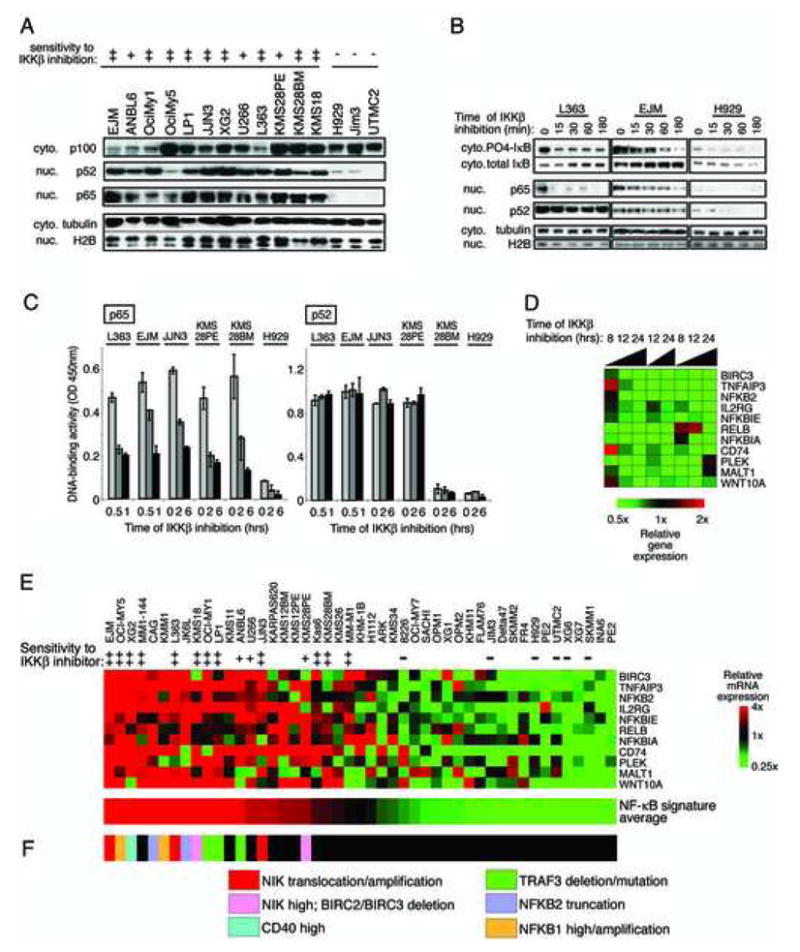
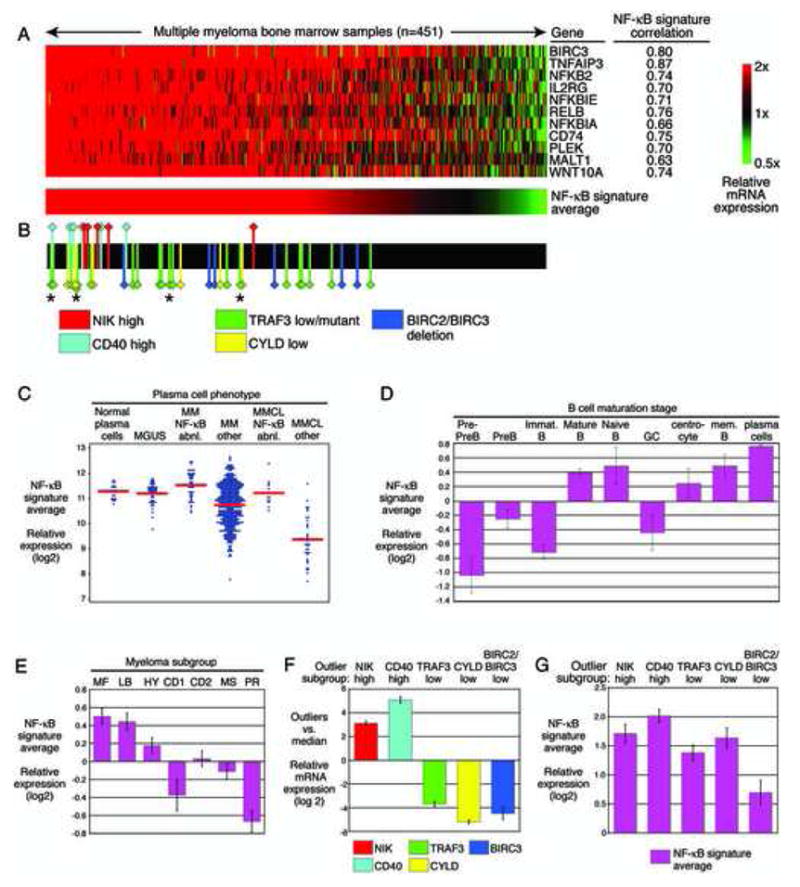
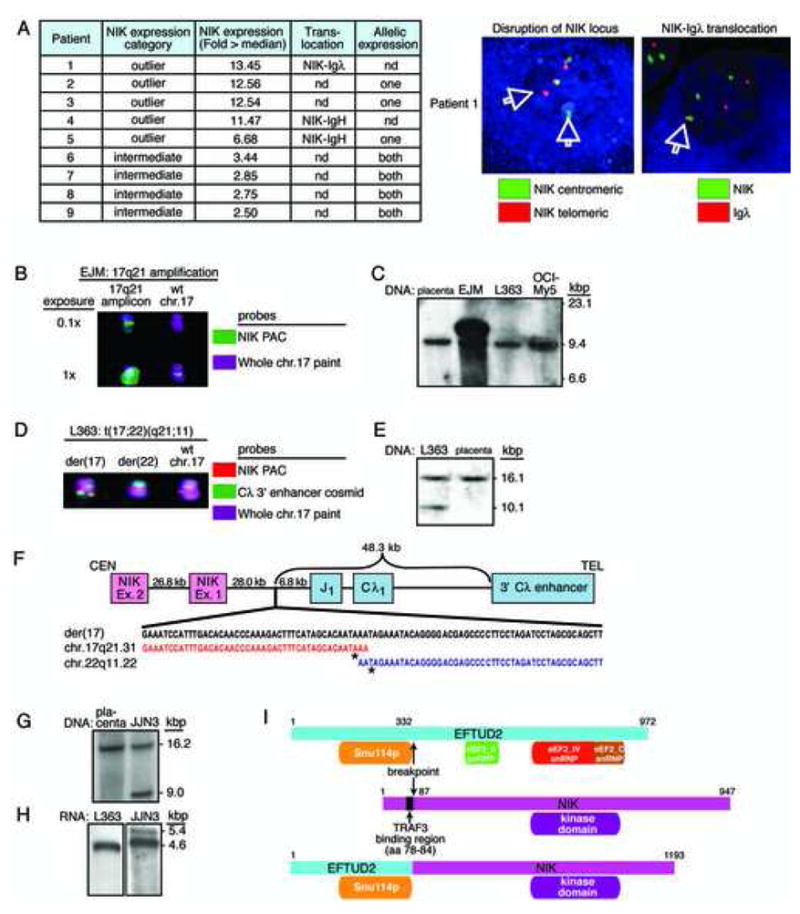
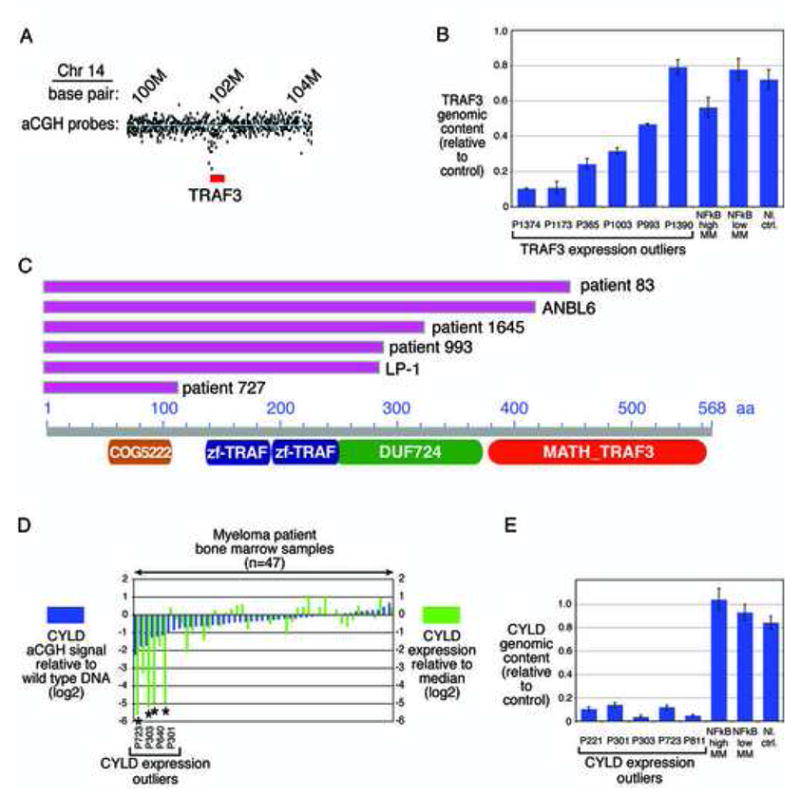
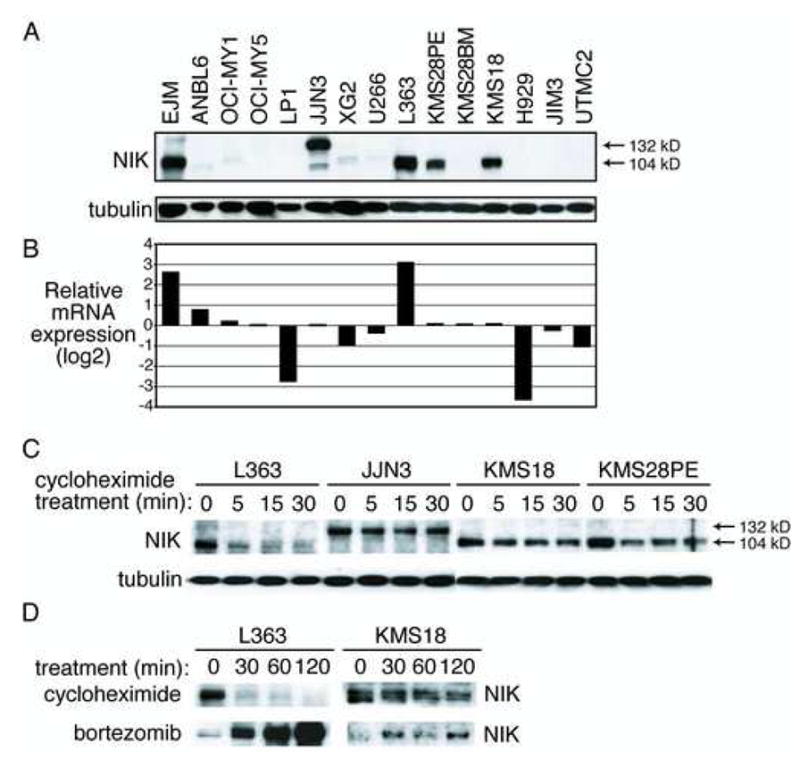
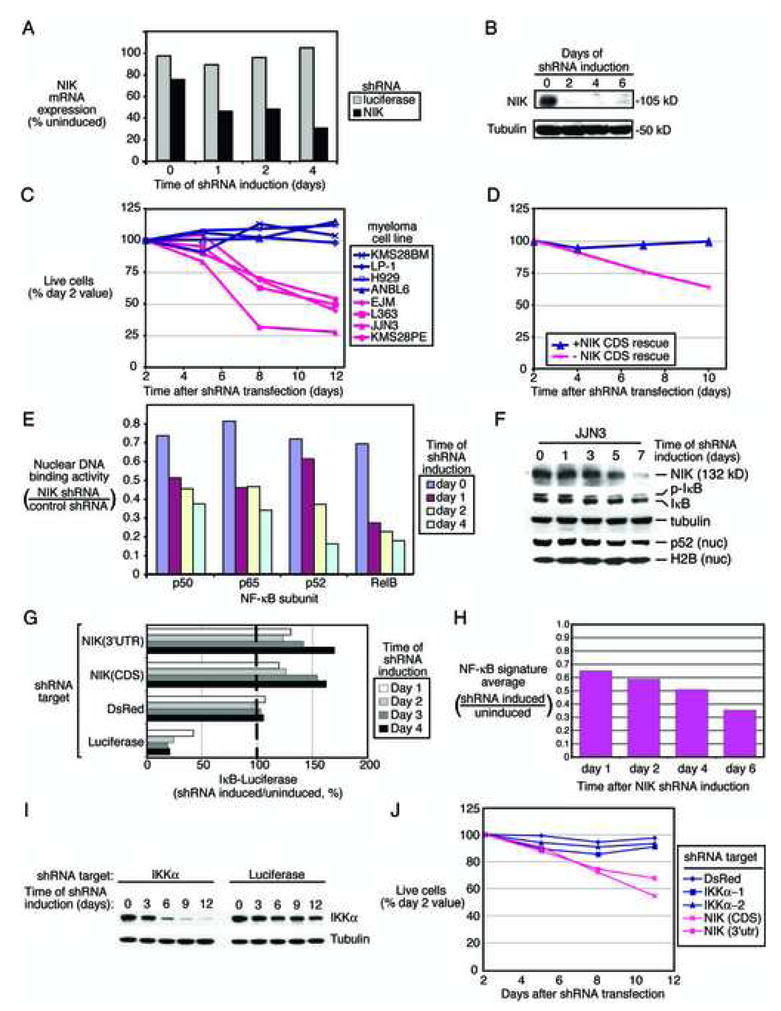
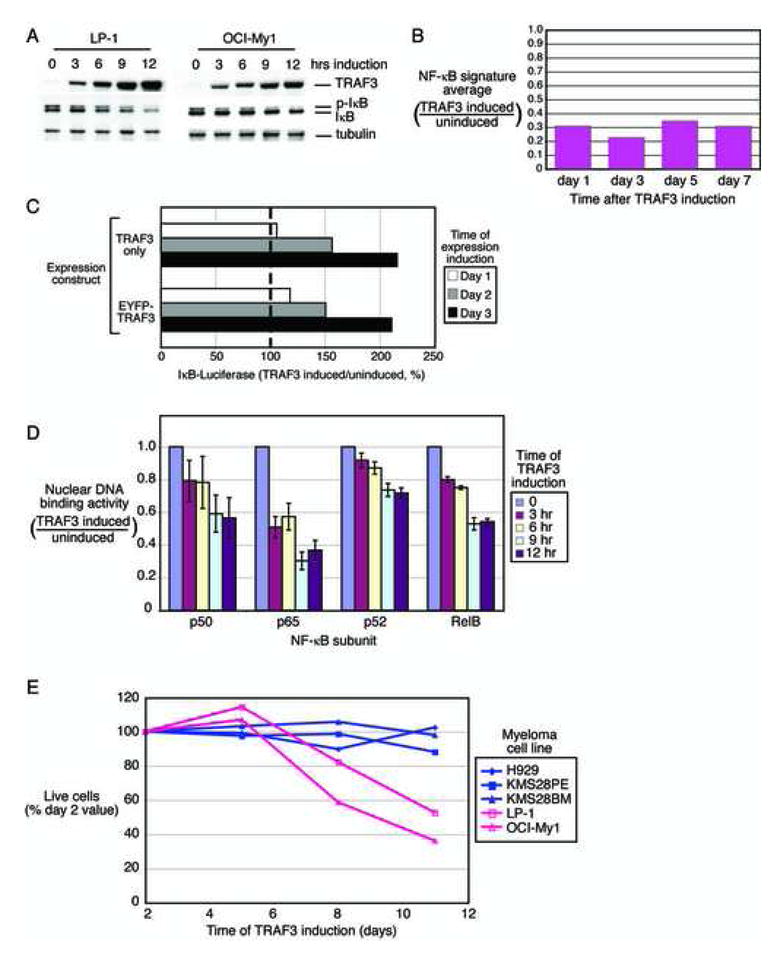
Mechanisms of constitutive NF-kappaB signaling in multiple myeloma are unknown. An inhibitor of IkappaB kinase beta (IKKbeta) targeting the classical NF-kappaB pathway was lethal to many myeloma cell lines. Several cell lines had elevated expression of NIK due to genomic alterations or protein stabilization, while others had inactivating mutations of TRAF3; both kinds of abnormality triggered the classical and alternative NF-kappaB pathways. A majority of primary myeloma patient samples and cell lines had elevated NF-kappaB target gene expression, often associated with genetic or epigenetic alteration of NIK, TRAF3, CYLD, BIRC2/BIRC3, CD40, NFKB1, or NFKB2. These data demonstrate that addiction to the NF-kappaB pathway is frequent in myeloma and suggest that IKKbeta inhibitors hold promise for the treatment of this disease.


Figures

Figure 1
Figure 1
A. Schematic of NF-κB signaling. B. Growth inhibition of MM cell lines by the IKKβ inhibitor MLN120b (MLN). Cell lines were cultured in the presence of MLN (25 μM), and cells were enumerated by flow cytometry as described (Davis et al., 2001). After 12 days, cell numbers were determined and displayed relative to a control culture treated with the same volume of DMSO (solvent) alone.
Figure 2
Figure 2
Effect of IKKβ inhibition on NF-κB signaling in MM cells. A: Steady state levels of NF-κB subunits in cytoplasmic or nuclear enriched protein fractions from cell lines. B: Effect of IKKβ inhibition by MLN on the abundance of NF-κB subunits and of total and phosphorylated IkBα. C: Effect of IKKβ inhibition on the nuclear DNA-binding activity of the NF-κB p65 and p52 subunits. Binding to an oligonucleotide containing the NF-κB consensus sequence was measured in nuclear extracts prepared from MM cells treated with MLN for the indicated times. DNA-binding activity was quantified by colorimetry (mean +/− SD). D: NF-κB target genes in MM. L363 cells were treated with the IKKβ inhibitor MLN for the indicated times and gene expression changes were assessed using DNA microarrays and depicted according to the color scale shown. E: Affymetrix U133plus2.0 microarray data from 47 MM cell lines were ordered using the average of the 11 NF-κB target genes determined in D, median centered, and depicted according to the color scale shown. F: Abnormalities of NF-κB pathway components and regulators in the indicated cell lines.
Figure 3
Figure 3
Multiple molecular mechanisms activate NF-κB in bone marrow PC from untreated MM patients. A: Expression of NF-κB target genes in primary MM patient samples. Affymetrix U133plus2.0 gene expression profiling data from 451 purified bone marrow plasma cell populations derived from untreated patients with MM (Zhan et al., 2006). Samples are ranked according to the average expression of the 11 NF-κB target genes. Expression was centered based on the median value in the MM cell lines (Figure 2E). B: MM samples with outlier gene expression and/or TRAF3 mutations. Cases with high NIK or CD40 expression and cases with low TRAF3, CYLD or BIRC2/BIRC3 expression are indicated with colored markers. The remaining cases are indicated in black. The asterisks indicate cases with inactivating TRAF3 mutations. C: NF-κB signature expression in normal and malignant plasma cell types. Data are taken from refs (Zhan et al., 2007; Zhan et al., 2006). D: NF-κB signature expression at different stages of human B cell differentiation. Shown are individual samples and the mean expression in each group. E: Expression of the NF-κB signature in MM gene expression subgroups. F: Expression of the indicated genes in the cases with outlier expression vs. other MM cases. G: Expression of the NF-κB signature in outliers. Shown is the NF-κB signature expression in outliers relative to the minimum expression in MM cell lines sensitive to IKKβ inhibition. In D – G, the mean value +/− S.E. is depicted.
Figure 4
Figure 4
Amplification or translocation of NIK in MM cell lines. A: Chromosomal translocations of NIK in primary MM patient samples. Three samples with NIK translocated to either the IGH locus or the IGL locus were documented by FISH (one representative sample shown at right). Other cases had monoallelic expression of NIK, consistent with a chromosomal translocation or other cis-acting event (see text for details). B: FISH analysis of NIK amplification in the EJM cell line. Two exposures are shown to illustrate the high level NIK amplicon on 17q21. C: Southern blot of NIK amplification in the EJM cell line. Genomic DNAs from the indicated cell lines were digested with HindIII and hybridized with a radiolabeled 568 bp PCR fragment amplified from NIK exon 15. D: FISH analysis of NIK translocation to the IGL locus in the L363 cell line. The signal from the 92 kb NIK PAC probe is split between the der(17) and der(22) chromosomes, and is also present on the wild type chr 17. The der(17) contains NIK sequences juxtaposed to the IGL enhancer. E: Southern blot of the NIK translocation in the L363 cell line. HpaI digest of genomic DNA hybridized with a NIK probe (Chr17:40,769,557–40,770,000 (build35)) shows a 16.1 kb wild type fragment in placental DNA and a 10.1 kb fragment in L363. F: Structure of the NIK translocation breakpoint in L363. CEN, centromeric end; TEL, telomeric end. The breakpoint on chr 17 is bp 40,778,164 (asterisk) and on chr 22 is bp 21,553,824 (asterisk) (NCBI build 35). G: Southern blot of the NIK translocation in JJN3 cells. HpaI digest of genomic DNA hybridized with NIK exon 5 probe shows the wild type locus as a 16.2 kb fragment. The translocated locus is a 9.0 kb fragment. H: Northern blot of NIK mRNA species. mRNA from L363 or JJN3 cells was hybridized with a radiolabeled cDNA probe derived from the 3′ end of the NIK mRNA. A wild type 4.6 kb mRNA species was detected in L363 cells (17 hr exposure). JJN3 cells (5 d exposure) show the wild type mRNA and an additional 5.4 kb mRNA, presumably from the translocated allele. I: Schematic of the EFTUD2-NIK fusion protein in JJN3 (see text for details).
Figure 5
Figure 5
Genetic abnormalities of the negative NF-κB regulators TRAF3 and CYLD in MM. A: Genomic deletion of TRAF3 in the OCI-MY1 cell line. aCGH estimated copy number from the TRAF3 genomic region in OCI-MY1 versus a normal reference. Blue line indicates average ratio for probes within wild type regions. The area depicted is ~3 Mb on chr 14 (NCBI build 35). Probes within the region encompassed by TRAF3 (red) indicate genomic deletion of the TRAF3 gene. B: qPCR analysis of TRAF3 copy number. Copy number estimates of TRAF3 relative to a control locus in 6 primary MM cases. Also shown is average copy number (+/− S.E.) in 12 cases each with high or low NF-kB signature expression and in 10 normal control samples. C: Mutations in TRAF3 that truncate the protein. Base pairs are numbered based on the TRAF3 reference sequence NM_145725. Resequencing revealed nucleotide deletions or mutations in two NF-κB-positive MM cell lines (LP-1, ANBL-6) and in 4 patient samples. These changes produced early termination of the TRAF3 protein at the positions indicated in the diagram. Each mutation would delete all or part of the carboxy-terminal MATH domain required for binding to NIK and TNF receptor superfamily members. D: Comparison of aCGH and gene expression data for CYLD in MM samples. Cases are ranked according to their aCGH signals (Agilent probe 420863) relative to wild type, with negative values indicating deletion, and compared with CYLD gene expression levels. The 4 CYLD gene expression outliers for which array CGH data were available are indicated. E: qPCR analysis of CYLD copy number. Copy number estimates of CYLD relative to a control locus in 5 primary MM cases. Also shown is average copy number (+/− S.E.) in 12 cases each with high or low NF-κB signature expression and in 10 normal control samples.
Figure 6
Figure 6
NIK protein overexpression in MM cell lines. A: Western blot of NIK protein levels in cytoplasmic extracts from the indicated cell lines. The wild type NIK protein is a 104 kD protein whereas the EFTUD2-NIK fusion protein in JJN3 is 132 kD. B: Relative NIK mRNA levels in cell lines as assessed by gene expression profiling on Affymetrix U133plus2.0 arrays (probe ID 205192_at). C: Enhanced NIK protein stability in a subset of myelomas. Western blot of NIK and tubulin levels before and after protein synthesis inhibition with cycloheximide. D: Proteasomal degradation of NIK varies in MM cell lines. L363 or KMS18 cells were treated with cycloheximide (20 μg/ml) or the proteasome inhibitor bortezomib (250 nM) for the indicated times and assayed for NIK levels.
Figure 7
Figure 7
Knockdown of NIK expression by RNA interference inhibits the NF-κB pathway in MM. A: Quantitative RT-PCR measurement of NIK mRNA levels following induction of the NIK shRNA in EJM cells. B: Western blot of NIK protein levels following induction of the NIK shRNA in EJM cells. C: Knockdown of NIK is toxic to NIK-overexpressing MM cell lines. The indicated cell lines were transduced with a retrovirus expressing the NIK shRNA (see Methods). Live cells were enumerated by FACS and normalized to the value at day 2 following retroviral infection. D: Expression of the NIK coding sequence rescues cell lines transduced with an shRNA targeting the NIK 3′UTR. EJM cells expressing a NIK coding region cDNA or control EJM cells were transduced with a retrovirus expressing an shRNA targeting the NIK 3′UTR. Live cells were enumerated as in C. E: Knockdown of NIK inhibits nuclear NF-κB DNA binding. DNA-binding activity by the indicated NF-κB subunits was quantified by ELISA. F: Knock down of the EFTUD2-NIK fusion protein in JJN3 cells affects NF-κB signaling via classical and alternative pathways. G: Inhibition of IKK activity by knock down of NIK in MM cell lines. EJM cells expressing an IkBα-luciferase fusion protein were superinfected with the indicated shRNAs. Induction of shRNAs targeting NIK caused a rise in luciferase activity indicating inhibition of IKK activity. Negative control shRNA targets DsRed; positive control shRNA targets luciferase. H: Inhibition of NF-κB target gene expression following knockdown of NIK in EJM cells. Relative expression of the NF-κB signature in shRNA induced versus uninduced cells is depicted. I: Western blot analysis of IKKα expression after induction of shRNAs targeting IKKα or luciferase. EJM cells were transduced with retroviral vectors expressing the indicated shRNAs and expression of IKKα and tubulin were monitored at the indicated times. J: Knockdown of IKKα is not toxic to a NIK-overexpressing myeloma. EJM cells were transduced with shRNAs targeting IKKα, NIK, or DsRed. Live cells were enumerated as in C.
Figure 8
Figure 8
Effect of re-expression of TRAF3 in cell lines with TRAF3 inactivation. A: Inducible expression of TRAF3 in LP-1 and OCI-My1 cells decreases phosphorylated-IkBα (pIkB). B: Inhibition of NF-κB target gene expression following expression of TRAF3 in LP-1 cells. Relative expression of the NF-κB signature in TRAF3 induced versus uninduced cells is depicted. C: Inhibition of IKK activity by expression of TRAF3. OCI-My1 cells expressing an IkBα-luciferase fusion protein were superinfected with retroviruses expressing either wild type TRAF3 or an EGFP-TRAF3 fusion protein. Induction of TRAF3 caused a rise in luciferase activity indicating inhibition of IKK activity. D: Effect of TRAF3 expression in OCI-My1 cells on the nuclear DNA-binding activity of the NF-κB p50, p65, p52, and RelB subunits. Binding to an oligonucleotide containing the NF-κB consensus sequence was measured in nuclear extracts prepared from cell lines induced to express TRAF3 relative to uninduced cells for the indicated times. DNA-binding activity was quantified by colorimetry (mean +/− SD). E. Toxicity of TRAF3 expression in LP-1 and OCI-My1, cell lines with TRAF3 inactivation. The indicated myeloma cell lines were transduced with a retrovirus expressing TRAF3. Live cells were enumerated by FACS and normalized to the value at day 2 following retroviral infection.

Similar articles

Cited by

References

    1. Alizadeh AA, Eisen MB, Davis RE, Ma C, Lossos IS, Rosenwald A, Boldrick JC, Sabet H, Tran T, Yu X, et al. Distinct types of diffuse large B-cell lymphoma identified by gene expression profiling. Nature. 2000;403:503–511. - PubMed
    1. Barlogie B, Shaughnessy J, Tricot G, Jacobson J, Zangari M, Anaissie E, Walker R, Crowley J. Treatment of multiple myeloma. Blood. 2004;103:20–32. - PubMed
    1. Basseres DS, Baldwin AS. Nuclear factor-kappaB and inhibitor of kappaB kinase pathways in oncogenic initiation and progression. Oncogene. 2006;25:6817–6830. - PubMed
    1. Berberich I, Shu GL, Clark EA. Cross-linking CD40 on B cells rapidly activates nuclear factor-kappa B. J Immunol. 1994;153:4357–4366. - PubMed
    1. Brummelkamp TR, Nijman SM, Dirac AM, Bernards R. Loss of the cylindromatosis tumour suppressor inhibits apoptosis by activating NF-kappaB. Nature. 2003;424:797–801. - PubMed

Publication types

MeSH terms