Coarse-grained biomolecular simulation with REACH: realistic extension algorithm via covariance Hessian
- PMID: 17693469
- PMCID: PMC2072085
- DOI: 10.1529/biophysj.107.111898
Coarse-grained biomolecular simulation with REACH: realistic extension algorithm via covariance Hessian
Abstract
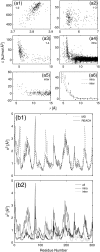
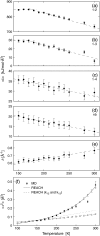
Coarse-graining of protein interactions provides a means of simulating large biological systems. Here, a coarse-graining method, REACH, is introduced, in which the force constants of a residue-scale elastic network model are calculated from the variance-covariance matrix obtained from atomistic molecular dynamics (MD) simulation. In test calculations, the C(alpha)-atoms variance-covariance matrices are calculated from the ensembles of 1-ns atomistic MD trajectories in monomeric and dimeric myoglobin, and used to derive coarse-grained force constants for the local and nonbonded interactions. Construction of analytical model functions of the distance-dependence of the interresidue force constants allows rapid calculation of the REACH normal modes. The model force constants from monomeric and dimeric myoglobin are found to be similar in magnitude to each other. The MD intra- and intermolecular mean-square fluctuations and the vibrational density of states are well reproduced by the residue-scale REACH normal modes without requiring rescaling of the force constant parameters. The temperature-dependence of the myoglobin REACH force constants reveals that the dynamical transition in protein internal fluctuations arises principally from softening of the elasticity in the nonlocal interactions. The REACH method is found to be a reliable way of determining spatiotemporal protein motion without the need for expensive computations of long atomistic MD simulations.
Figures


Similar articles
-
REACH coarse-grained biomolecular simulation: transferability between different protein structural classes.Biophys J. 2008 Aug;95(4):1639-48. doi: 10.1529/biophysj.108.131714. Epub 2008 May 9. Biophys J. 2008. PMID: 18469078 Free PMC article.
-
REACH coarse-grained simulation of a cellulose fiber.Biomacromolecules. 2012 Sep 10;13(9):2634-44. doi: 10.1021/bm300460f. Epub 2012 Aug 31. Biomacromolecules. 2012. PMID: 22937726
-
REACH coarse-grained normal mode analysis of protein dimer interaction dynamics.Biophys J. 2009 Aug 19;97(4):1158-67. doi: 10.1016/j.bpj.2009.05.015. Biophys J. 2009. PMID: 19686664 Free PMC article.
-
Calculation of Enzyme Fluctuograms from All-Atom Molecular Dynamics Simulation.Methods Enzymol. 2016;578:327-42. doi: 10.1016/bs.mie.2016.05.024. Epub 2016 Jun 20. Methods Enzymol. 2016. PMID: 27497173 Review.
-
On developing coarse-grained models for biomolecular simulation: a review.Phys Chem Chem Phys. 2012 Sep 28;14(36):12423-30. doi: 10.1039/c2cp40934h. Epub 2012 Jun 8. Phys Chem Chem Phys. 2012. PMID: 22678152 Review.
Cited by
-
FlexE: Using elastic network models to compare models of protein structure.J Chem Theory Comput. 2012 Oct 9;8(10):3985-3991. doi: 10.1021/ct300148f. J Chem Theory Comput. 2012. PMID: 25530735 Free PMC article.
-
A new approach for extracting information from protein dynamics.ArXiv [Preprint]. 2022 Mar 16:arXiv:2203.08387v1. ArXiv. 2022. Update in: Proteins. 2023 Feb;91(2):183-195. doi: 10.1002/prot.26421. PMID: 35313540 Free PMC article. Updated. Preprint.
-
Gating mechanisms of mechanosensitive channels of large conductance, II: systematic study of conformational transitions.Biophys J. 2008 Jul;95(2):581-96. doi: 10.1529/biophysj.107.128496. Epub 2008 Apr 4. Biophys J. 2008. PMID: 18390625 Free PMC article.
-
Energy landscape of all-atom protein-protein interactions revealed by multiscale enhanced sampling.PLoS Comput Biol. 2014 Oct 23;10(10):e1003901. doi: 10.1371/journal.pcbi.1003901. eCollection 2014 Oct. PLoS Comput Biol. 2014. PMID: 25340714 Free PMC article.
-
PIM: phase integrated method for normal mode analysis of biomolecules in a crystalline environment.J Mol Biol. 2013 Mar 25;425(6):1082-98. doi: 10.1016/j.jmb.2012.12.026. Epub 2013 Jan 16. J Mol Biol. 2013. PMID: 23333742 Free PMC article.
References
-
- Klotz, I. M. 1985. Ligand-receptor interactions: facts and fantasies. Q. Rev. Biophys. 18:227–259. - PubMed
-
- Benkovic, S. J., C. A. Fierke, and A. M. Naylor. 1988. Insights into enzyme function from studies on mutants of dihydrofolate reductase. Science. 239:1105–1110. - PubMed
-
- Frauenfelder, H., S. G. Sligar, and P. G. Wolynes. 1991. The energy landscapes and motions of proteins. Science. 254:1598–1603. - PubMed
-
- Lian, L. Y., I. L. Barsukov, M. J. Sutcliffe, K. H. Sze, and G. C. Roberts. 1994. Protein-ligand interactions: exchange processes and determination of ligand conformation and protein-ligand contacts. Methods Enzymol. 239:657–700. - PubMed
-
- Lamb, M. L., and W. L. Jorgensen. 1997. Computational approaches to molecular recognition. Curr. Opin. Chem. Biol. 1:449–457. - PubMed
Publication types
MeSH terms
Substances
LinkOut - more resources
Full Text Sources
Miscellaneous

